Water Quality Index Calculation: From Sensor Readings to Compliance Score
Learn how to calculate the Indeks Pencemaran (IP) and STORET water quality index from continuous sensor data — formula, worked example, and interpretation.

Continuous water quality sensors produce pH, dissolved oxygen (DO), TSS, and COD readings every few minutes — but individual parameter values alone do not answer whether a water body or effluent meets its quality standard. A water quality index calculation converts those parameter readings into a single compliance score that regulators and management can act on.
In Indonesia, water quality status determination follows KepMen LH No. 115/2003, which defines two official methods: the Indeks Pencemaran (IP) — translated as Pollution Index — and the STORET method. This article explains the IP formula, walks through a calculation using typical sensor data, and compares when each method fits continuous monitoring workflows. Note: these methods apply under Indonesian jurisdiction; other countries use different index systems such as the NSF WQI (USA) or CCME WQI (Canada).
Why a Single Index Score Matters
A daily report from a continuous monitoring system may contain hundreds of rows per parameter. An operator reading pH 6.8 and DO 5.2 mg/L still needs to answer: “Does this water meet its designated standard?”
The answer depends on the water body classification. Indonesia’s PP No. 22/2021 on Environmental Protection and Management classifies water bodies into Classes I–IV, each with different quality standards. KepMen LH 115/2003 then provides the mechanism to compare measured values against those class-specific standards and produce a single status number — the pollution index.
Without an index calculation, sensor data remains a collection of disconnected values that are difficult to compare across locations or reporting periods.
Indeks Pencemaran (IP): Indonesia’s Standard Method
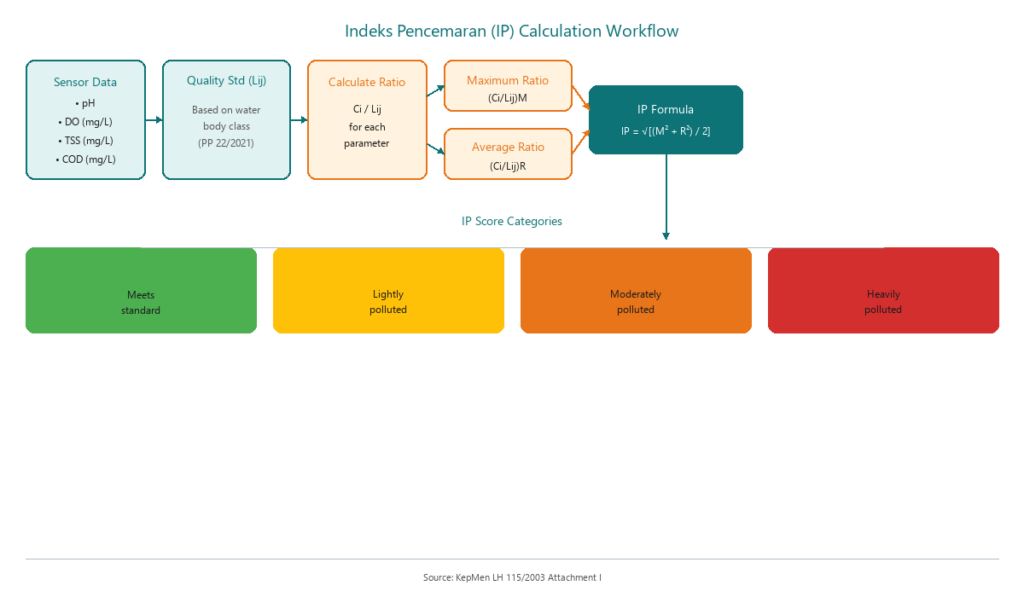
The IP method is defined in Attachment I of KepMen LH 115/2003. Its principle: each parameter is compared to the quality standard for the designated water use as a ratio, then those ratios are combined into a single score.
The IP Formula
IP_j = √ [ (C_i / L_ij)²_M + (C_i / L_ij)²_R ] / 2
Where:
- IP_j = Pollution Index for designation j
- C_i = measured concentration of parameter i (from sensor)
- L_ij = quality standard for parameter i under designation j
- C_i / L_ij = ratio of concentration to quality standard
- (C_i / L_ij)_M = maximum ratio across all parameters
- (C_i / L_ij)_R = average ratio across all parameters
Parameters with range-based standards (e.g., pH 6–9) use a special ratio approach. Parameters like DO, where higher values indicate better quality, also require ratio adjustment — a measured value below the standard produces a ratio greater than 1. Verify the exact handling rules in KepMen LH 115/2003 Attachment I before implementing in a reporting system.
IP Score Categories
| IP Score | Category | Indonesian Term |
|---|---|---|
| 0 ≤ IP ≤ 1.0 | Meets quality standard | Memenuhi baku mutu |
| 1.0 < IP ≤ 5.0 | Lightly polluted | Cemar ringan |
| 5.0 < IP ≤ 10.0 | Moderately polluted | Cemar sedang |
| IP > 10.0 | Heavily polluted | Cemar berat |
These categories come directly from KepMen LH 115/2003.
Worked IP Calculation with Sensor Data
The following illustrative example uses four parameters commonly measured by online sensors. Quality standards reference Class II as an example — verify actual values from PP 22/2021 Attachment VI before using for official reporting.
Sensor readings (illustrative example):
| Parameter | Sensor Value (C_i) | Class II Standard (L_ij) | Ratio (C_i / L_ij) |
|---|---|---|---|
| pH | 7.2 | 6–9 (midpoint: 7.5) | (7.5 − 7.2) / (7.5 − 6) = 0.20 |
| DO | 5.0 mg/L | ≥ 4 mg/L | Since C_i > L_ij: ratio < 1 → 0 (meets standard) |
| TSS | 38 mg/L | ≤ 50 mg/L | 38/50 = 0.76 |
| COD | 20 mg/L | ≤ 25 mg/L | 20/25 = 0.80 |
Calculation steps:
- Calculate C_i/L_ij ratio for each parameter (see table above)
- Identify the maximum ratio: (C_i/L_ij)_M = 0.80 (COD)
- Calculate average ratio: (C_i/L_ij)_R = (0.20 + 0 + 0.76 + 0.80) / 4 = 0.44
- Apply the IP formula:
IP = √ [ (0.80)² + (0.44)² ] / 2 = √ [ 0.64 + 0.1936 ] / 2 = √ 0.4168 = 0.646
Result: IP = 0.646 → Meets quality standard (category 0 ≤ IP ≤ 1.0)
This example is illustrative. The ratio handling for pH and DO follows specific provisions in KepMen LH 115/2003 Attachment I — consult the full regulatory text for official reporting implementation.
STORET Method: When You Have Historical Data Series
The STORET method is defined in Attachment II of KepMen LH 115/2003. Unlike IP, which calculates a score from a single measurement set, STORET evaluates a time-series of measurements over a defined period.
How STORET Works
STORET compares each measurement result against the quality standard. Each time a parameter exceeds its standard, the system assigns a negative score. The total negative score determines the status:
| Total Score | Category |
|---|---|
| 0 | Meets quality standard |
| −1 to −10 | Lightly polluted |
| −11 to −30 | Moderately polluted |
| ≤ −31 | Heavily polluted |
STORET scoring uses minimum, maximum, and average values from the data series, with different weights for physical, chemical, and biological parameters.
IP vs STORET: When to Use Each
| Aspect | IP | STORET |
|---|---|---|
| Data input | Single measurement set | Multi-period data series |
| Best suited for | Current condition snapshot | Trend evaluation over a period |
| With continuous sensor data | Apply per reporting interval | Apply to periodic data aggregates |
| Sensitivity | Sensitive to worst parameter (max ratio) | Sensitive to exceedance frequency |
For continuous monitoring systems like ONLIMO (river water quality) and SPARING (industrial wastewater), IP is typically used for daily or per-interval status reporting, while STORET is applied to monthly or quarterly evaluations.
Continuous Sensor Data vs Grab Samples: Impact on the Index
Continuous monitoring captures far more data points than periodic manual grab sampling. This means sensors can record transient excursions — a TSS spike during heavy rain or a DO dip in early morning — that grab samples might miss.
The impact on index calculations:
- IP: Transient excursions can increase the maximum ratio and shift the score to a worse category if calculated from real-time data without filtering
- STORET: More data points mean more opportunities for parameters to exceed standards, increasing the cumulative negative score
This makes sensor data quality critical. Readings flagged as suspect — from a fouling sensor or during calibration — should be excluded before index calculation. Periodic comparison between online sensor readings and laboratory results also helps maintain input data reliability. Regular sensor maintenance prevents fouling-driven false exceedances that would distort the index.
Interpreting Results: From Score to Action
An IP score is not just a compliance number. Each category points to a different response:
- Meets standard (IP ≤ 1.0): Continue routine monitoring. Document for periodic reporting.
- Lightly polluted (1.0 < IP ≤ 5.0): Identify the parameter contributing the highest ratio. Determine whether the cause is temporary or systemic.
- Moderately polluted (5.0 < IP ≤ 10.0): Investigate pollution source. Check whether sensor data is valid — review pH sensor troubleshooting and maintenance records to rule out fouling effects.
- Heavily polluted (IP > 10.0): High-priority action. Verify sensor readings, validate with laboratory samples, and report per applicable requirements.
The parameter contributing the highest ratio in the IP formula is the most informative indicator of the problem source. If the TSS ratio dominates the score, the investigation focuses on suspended solid sources upstream or in the process.
Next Step
Water quality index calculation requires accurate, continuous sensor data as input. If your organization needs a water quality monitoring system that produces index-ready data — from multi-parameter sensors to reporting dashboards — contact the Fortuna Argatech technical team for a system consultation.
Share this article
Share this insight with your team.
Related Articles
Similar topics from the same category.

Poor weather station placement can cause 50% data bias. Learn the WMO-No. 8 and Indonesian BMKG siting standards for AWS sensors in industrial and mining sites.

Explore a technical engineering comparison between solid-state ultrasonic anemometers and mechanical cup-and-vane sensors for industrial weather stations.

Technical guide to conductivity sensors: comparing toroidal (inductive), 2-electrode, and 4-electrode contacting probes for industrial water and wastewater.