Dissolved Oxygen mg/L vs Percent Saturation: What to Use
Distinguish dissolved oxygen in mg/L from percent saturation. Learn how temperature, pressure, salinity, and system settings affect interpretation.
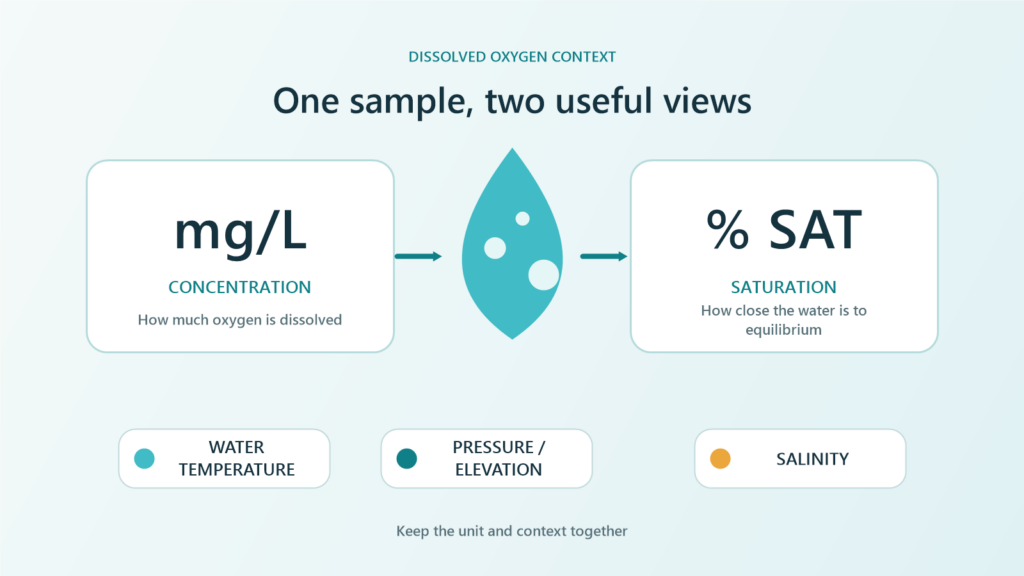
Dissolved oxygen saturation and concentration in mg/L answer two different questions. mg/L reports how much oxygen is dissolved in the water, while percent saturation describes how close that concentration is to equilibrium under the relevant temperature, pressure, and salinity conditions.
For operational monitoring, the two values should not be exchanged without context. Retain the concentration, water temperature, unit, and measurement time; when the instrument provides percent saturation, also preserve the value and the settings used to calculate it.
The official Fortuna Argatech ONLIMO page lists dissolved oxygen and temperature among parameters available according to the system configuration. A useful implementation therefore does more than display a number. The path from the sensor through a data logger or gateway to the dashboard needs to preserve units and context so each value remains interpretable.
Dissolved oxygen saturation does not replace mg/L
DO concentration in mg/L describes the mass of dissolved oxygen per volume of water. This representation is commonly needed when a procedure, criterion, alarm, or process review requires the actual oxygen concentration.
Percent saturation is a ratio between the measured DO and the oxygen concentration expected at equilibrium. Because the equilibrium concentration changes with environmental conditions, the percentage cannot be calculated correctly from mg/L alone without supporting inputs.
| Question | DO in mg/L | Percent saturation |
|---|---|---|
| What does it report? | Dissolved-oxygen concentration | Proximity to equilibrium saturation |
| Main context | Water volume and concentration unit | Temperature, pressure or elevation, and salinity where relevant |
| Common use | Compare a value with a process need, method, or criterion | Interpret physical conditions and compare the degree of saturation |
| Interpretation risk | Treating the number as sufficient without temperature and time | Treating the percentage as a universal target or independent value |
| Data to retain | Temperature, timestamp, and quality status | Concentration, temperature, pressure source, salinity, and calculation method |
The better question is therefore not which value is more correct, but which decision the data must support. A report may require mg/L, while a review of aeration or a daily cycle may benefit from percent saturation. Many monitoring systems gain a clearer audit trail by retaining both.
Why can the same mg/L produce a different percentage?
Water does not have one fixed oxygen capacity. The USGS page Dissolved Oxygen and Water explains that temperature affects how much oxygen water can hold. Colder water can contain more dissolved oxygen than warmer water under otherwise comparable conditions.
The same concentration can consequently represent a different degree of saturation on a cold morning and a warm afternoon. There is no contradiction: mg/L still reports concentration, while the percentage compares that concentration with the equilibrium capacity under the current conditions.
Atmospheric pressure also matters. At higher elevations, pressure is generally lower, so the saturation concentration differs from a site near sea level. An instrument may use a barometric sensor, a pressure entered by the operator, or an elevation setting. Teams need to identify that source before comparing results from different devices.
Salinity adds another factor in brackish or marine water because dissolved salts reduce oxygen solubility. If one instrument applies salinity compensation and another assumes fresh water, their percentages may differ even when their measured concentrations are close.
Read a DO change before assigning a cause
Several processes shape a dissolved-oxygen trend. Atmospheric exchange, mixing, aeration, photosynthesis, respiration, and organic-matter decomposition can raise or lower oxygen. Temperature and hydraulic conditions may change at the same time.
The following patterns are useful starting points for investigation, not automatic diagnoses:
- mg/L and percent saturation fall together. Check for a temperature rise, greater oxygen demand, flow changes, aeration problems, or a measurement issue.
- mg/L remains fairly stable while the percentage changes. Review temperature, pressure, salinity, and calculation inputs before concluding that water quality changed substantially.
- The value exceeds 100 percent. Supersaturation can occur, including during strong photosynthesis or aeration. Also check bubbles on the probe, installation, cleanliness, and instrument compensation.
- Two instruments show similar mg/L but different percentages. Compare temperature, barometric pressure or elevation, salinity, algorithms, rounding, and timestamps.
One value cannot identify a cause by itself. Process data, weather, time of day, biological activity, sensor condition, and field inspection help separate a real change from installation or configuration problems.
Which fields should a monitoring system retain?
A telemetry system that stores only a field named DO can create questions later. The label does not reveal the unit, value type, compensation, or sensor status. Where the device and project architecture support them, use separate fields for:
- DO concentration in mg/L;
- percent saturation;
- water temperature paired with the reading;
- the barometric-pressure source or elevation setting;
- salinity value or compensation mode where relevant;
- timestamp, time zone, quality status, and device status;
- configuration version, calibration or verification time, and maintenance notes.
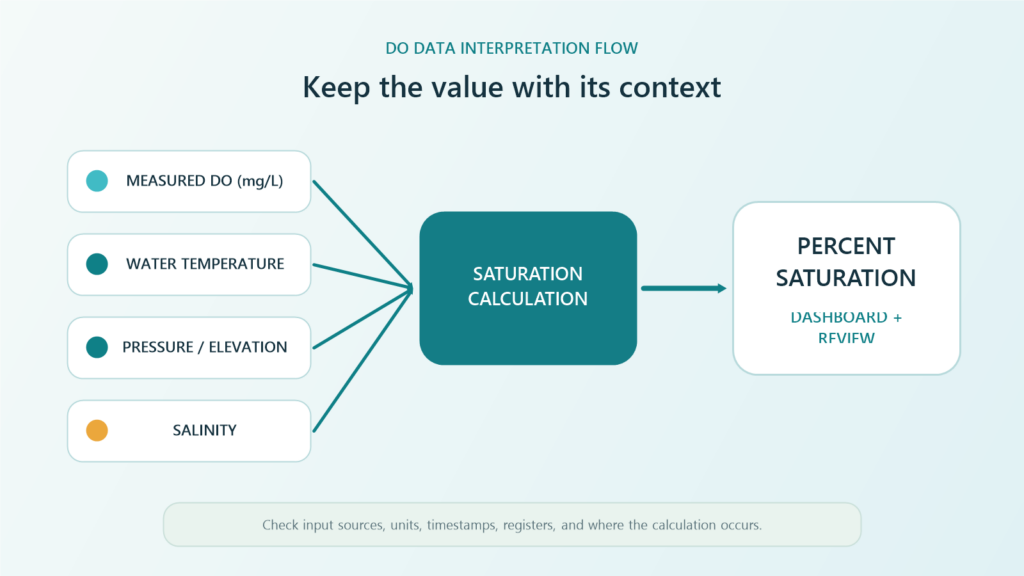
Not every instrument exposes every field. The objective is not unlimited data collection, but the minimum traceability needed to understand the value. The selected model manual, register map, and server configuration determine which fields are available and where the calculation occurs.
Check dissolved oxygen saturation during commissioning
1. Confirm the user’s data requirement
Record whether reports, alarms, process control, or analysis require mg/L, percent, or both. Do not replace a unit simply because one display looks easier to read.
2. Identify the source of every value
Determine whether the probe, transmitter, data logger, PLC, or server calculates the percentage. Avoid applying another formula to an already compensated value without clear documentation.
3. Match temperature and time
Compare DO and temperature from the same timestamp. A time mismatch can make their relationship look unreasonable when temperature or the process changes quickly.
4. Verify pressure and salinity
Confirm the pressure source, site elevation, and fresh, brackish, or marine-water setting. Use the device manual and project procedure to select the correct inputs.
5. Compare each data layer
Record the local instrument, transmitter, data logger or gateway, and dashboard values. Differences can reveal scaling, unit, rounding, register, or formula problems.
6. Test with the approved procedure
Perform verification, calibration, bubble checks, cleaning, and response tests according to the model manual and data-quality objective. A general article cannot set the test medium or acceptance limit for every sensor.
Treat DO as a system decision
Dissolved oxygen saturation helps explain concentration in relation to physical conditions, but it does not remove the need to review mg/L, temperature, process state, and site conditions. Concentration without context can also create misleading comparisons when temperature, elevation, or salinity differs.
Fortuna Argatech can help review parameter requirements, field selection, communications integration, register mapping, dashboards, and commissioning plans for a site-configured ONLIMO system. Before a technical discussion, prepare the probe model, manual, register map, elevation, salinity range, sample raw data, and the intended use of each DO value. To review your monitoring design, contact the Fortuna Argatech team.
Sources
- U.S. Geological Survey. Dissolved Oxygen and Water, 5 June 2018. https://www.usgs.gov/special-topics/water-science-school/science/dissolved-oxygen-and-water
- U.S. Environmental Protection Agency. Dissolved Oxygen, CADDIS Volume 2. https://www.epa.gov/caddis-vol2/dissolved-oxygen
Share this article
Share this insight with your team.
Related Articles
Similar topics from the same category.

Poor weather station placement can cause 50% data bias. Learn the WMO-No. 8 and Indonesian BMKG siting standards for AWS sensors in industrial and mining sites.
Explore a technical engineering comparison between solid-state ultrasonic anemometers and mechanical cup-and-vane sensors for industrial weather stations.

Technical guide to conductivity sensors: comparing toroidal (inductive), 2-electrode, and 4-electrode contacting probes for industrial water and wastewater.