Sensor Temperature Compensation: What Does It Correct?
Sensor temperature compensation is parameter-specific. Compare pH ATC, conductivity at 25 °C, register mapping, and dashboard checks.
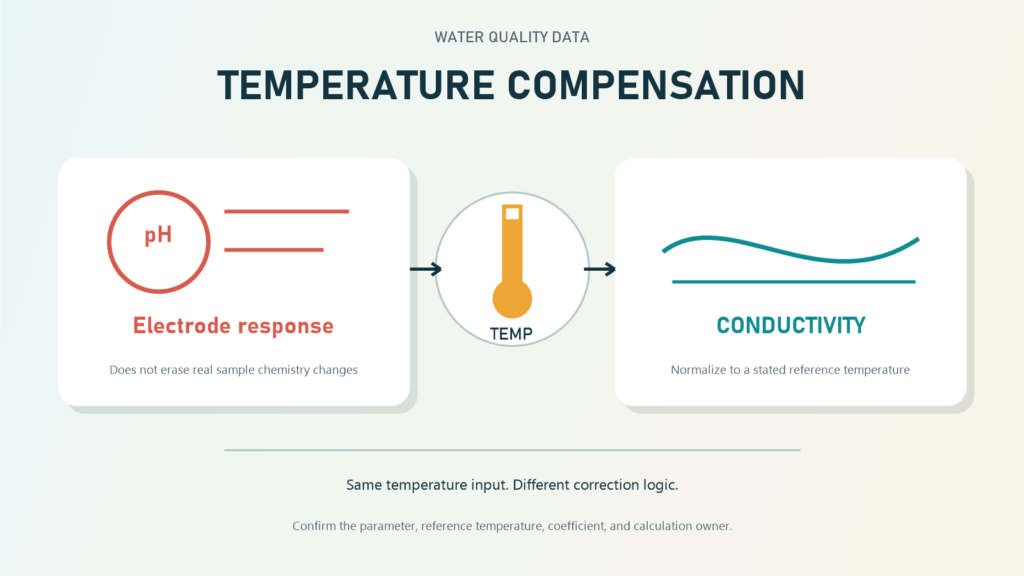
Sensor temperature compensation is not a switch that removes every temperature effect from water-quality data. For pH, compensation primarily addresses the electrode’s electrical response; for conductivity, the calculation commonly normalizes conductance to a defined reference temperature.
The distinction matters when teams compare values shown by a sensor, transmitter, data logger, and dashboard. If the source is unclear, a raw value may be compared with a compensated value or corrected a second time without anyone noticing.
The official Fortuna Argatech pages for the pH Meter Sensor and ONLIMO provide sensor and online-monitoring context. The active coefficient, reference temperature, and calculation location still need to follow the selected device and project design.
Sensor temperature compensation has parameter-specific meaning
The label Automatic Temperature Compensation (ATC) may look identical across instrument menus. The function behind that label is not necessarily identical because each parameter has a different measurement principle and correction objective.
| Aspect | pH | Conductivity |
|---|---|---|
| Primary value | Hydrogen-ion activity inferred through electrode response | A solution’s ability to conduct current through dissolved ions |
| Role of temperature | Affects electrode response and can change the sample’s actual pH | Affects ion mobility and measured conductance |
| Common compensation objective | Correct the temperature response of the electrode | Calculate a value at a reference temperature, often 25 °C |
| What is not automatically corrected | A real chemical change in sample pH | A change in ion composition or water chemistry |
| Configuration to retain | Temperature input, ATC mode, calibration, and sample temperature | Raw value, temperature, reference temperature, coefficient or algorithm |
The useful question is therefore not only “is ATC enabled?” A team also needs to ask which parameter is being corrected, which source value enters the calculation, which algorithm is active, and which value is sent downstream.
pH ATC corrects electrode response, not the entire sample chemistry
Electrometric pH measurement uses a measuring electrode and a reference system. The electrode’s electrical response changes with temperature. ATC can use a temperature reading to correct that part of the response so the instrument calculates pH according to the electrode behavior.
EPA Method 150.2 distinguishes electrode-response correction from a real change in sample pH. Water chemistry can reach a different equilibrium when temperature changes. ATC does not identify the full sample composition and automatically transform it into the pH the sample would have at 25 °C.
The operational consequence is straightforward. When process pH moves at the same time as temperature, the difference should not immediately be labeled sensor drift. Retain temperature, process condition, stabilization time, and comparison results. The related pH sensor troubleshooting guide covers other causes such as fouling, bubbles, connections, buffers, and an unrepresentative measurement point.
The USGS Measurement of pH guidance also treats temperature as part of measurement, calibration, and response evaluation. Cold water can slow stabilization, so an unsettled value is not a problem that ATC alone can solve.
Conductivity compensation normalizes to a reference temperature
Conductivity changes as temperature affects ion mobility. The USGS Specific Conductance guidance notes a change of roughly 0.5 to 3 percent per degree Celsius depending on the ionic species. That range itself shows why one coefficient does not represent every water matrix.
To make data more comparable, an instrument may report specific conductance: conductivity referenced or corrected to 25 °C. Modern meters may use linear or nonlinear algorithms. The active mode, coefficient, and validity limits need to come from the instrument manual rather than from assumptions about a register named conductivity.
This compensation reduces the temperature contribution to the conductance reading. It does not correct a different mixture of ions. If source water, process conditions, chemical dosing, or saline intrusion changes, specific conductance can still move because the water chemistry has genuinely changed.
Four configuration errors that are easy to miss
1. A compensated value is calculated again
The sensor may transmit specific conductance at 25 °C while the data logger or server applies another temperature formula. The result is a second transformation, not simply another display format. Check the register map and formulas at every layer.
2. The register name is too generic
A label such as pH, EC, or conductivity does not reveal the reference temperature, ATC mode, unit, or temperature-sensor status. Dashboard names should distinguish raw and compensated values when both are available.
3. Temperature does not represent the same sample
Compensation needs a temperature that is relevant to the sensing element. Position, response time, flow, and a temperature difference between the probe and sample can affect interpretation. Confirm that the temperature element and primary measurement have equilibrated according to the device procedure.
4. A chemistry change is treated as a temperature error
ATC does not repair fouling, poor calibration, damaged cables, bubbles, changing ion composition, or an unrepresentative location. Separate the temperature check from checks of sensor condition, process state, and the data path.
Verify the compensation path before commissioning
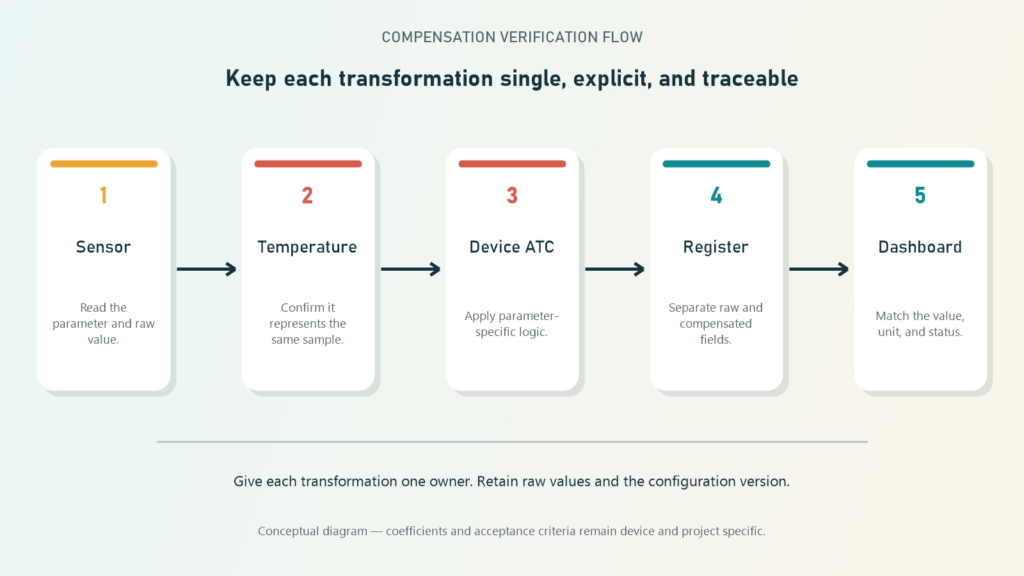
1. Define the required values
Record whether the system needs pH with ATC, pH and temperature as a pair, conductivity at sample temperature, specific conductance at 25 °C, or several fields. The decision should follow the data use rather than every value available in the menu.
2. Assign calculation ownership
Decide whether compensation belongs in the sensor or transmitter, data logger, PLC, or server. One transformation should have a clear owner, formula, configuration version, and record.
3. Match the manual and register map
Verify units, data type, byte order where relevant, reference temperature, coefficient, ATC status, and defaults. Do not infer a register’s meaning from its short name.
4. Compare each point in the path
During commissioning, capture the local instrument, transmitter, data logger or gateway, and dashboard values at the same time. Differences help locate a change in scaling, rounding, compensation, or mapping.
5. Test temperature change under controlled conditions
Use an approved procedure and test medium to confirm that temperature is read correctly, the value stabilizes, and the transformation follows the design. Acceptance criteria must come from the model manual, data-quality objective, and project procedure.
6. Retain context for later review
Store the raw value when available, compensated value, temperature, reference temperature, coefficient or method, timestamp, quality status, and configuration version. These records make a later data shift explainable.
Treat compensation as a system function
Temperature compensation does not end at the probe. It touches sensor selection, transmitter configuration, registers, data logger or gateway logic, storage, field names, alarms, and dashboard presentation. One undocumented setting can change the meaning of data throughout that chain.
Fortuna Argatech can support a review of parameter requirements, data architecture, communications, register mapping, dashboard fields, and commissioning steps for pH or ONLIMO configurations. Before a technical discussion, prepare the device model, manual, register map, intended reference temperature, and example values from each layer. To discuss a design or review a project’s compensation path, contact Fortuna Argatech.
Sources
- U.S. Geological Survey. Specific Conductance, Techniques and Methods 9-A6.3, revised February 2019. https://pubs.usgs.gov/tm/09/a6.3/tm9-a6_3.pdf
- U.S. Environmental Protection Agency. Method 150.2: pH, Continuous Monitoring (Electrometric) by pH Meter, December 1982. https://www.epa.gov/sites/default/files/2015-08/documents/method_150-2_1982.pdf
- U.S. Geological Survey. Measurement of pH, Techniques and Methods 9-A6.4, revised February 2021. https://pubs.usgs.gov/tm/09/a6.4/tm9a6.4.pdf
Share this article
Share this insight with your team.
Related Articles
Similar topics from the same category.

Poor weather station placement can cause 50% data bias. Learn the WMO-No. 8 and Indonesian BMKG siting standards for AWS sensors in industrial and mining sites.

Explore a technical engineering comparison between solid-state ultrasonic anemometers and mechanical cup-and-vane sensors for industrial weather stations.

Technical guide to conductivity sensors: comparing toroidal (inductive), 2-electrode, and 4-electrode contacting probes for industrial water and wastewater.