pH Sensor Troubleshooting: Fix Drift, Slow Response, and Unstable Readings
Diagnose pH sensor drift, slow response, and unstable readings by separating electrode, process, installation, and signal-chain faults.
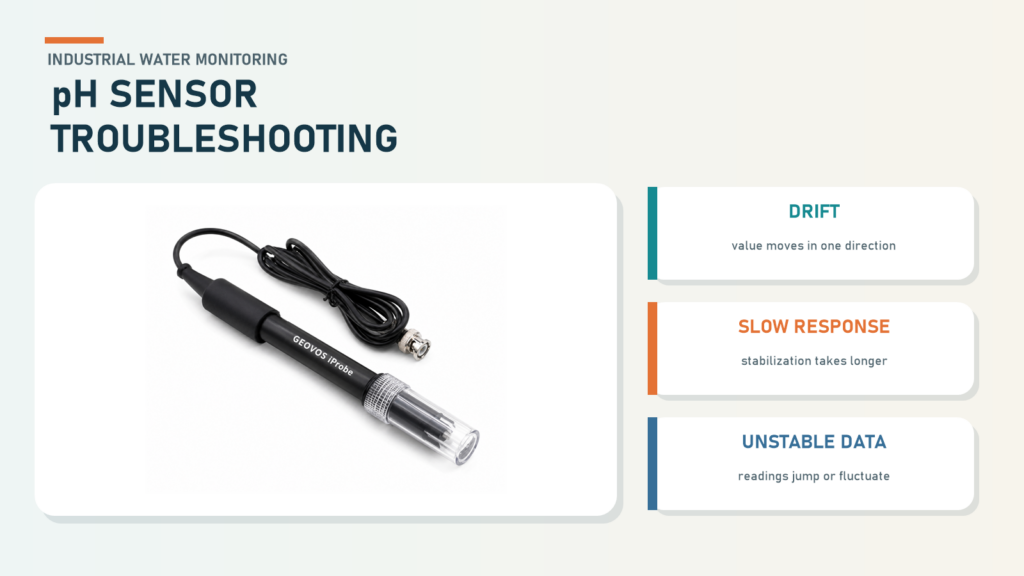
pH sensor troubleshooting should separate electrode, process, installation, and data-path faults before anyone changes the calibration. Drift, slow response, and jumping values may look similar on a dashboard, but they do not necessarily come from the same part of the measurement system.
In an integrated installation, the sensing element is only one link in the chain. Fortuna Argatech’s pH Meter Sensor page lists industrial integration options, while its SPARING system provides a continuous wastewater-monitoring context. A useful investigation therefore follows the value from the electrode and transmitter through the controller or data logger to the monitoring application used on site.
pH sensor troubleshooting starts with the symptom
Avoid grouping every complaint under “inaccurate sensor.” Record what the signal is doing, when the behavior began, and whether the same problem appears locally and in the central system. The 2021 USGS pH field manual distinguishes failed calibration, slow response, and erratic readings because each symptom points to a different set of checks.
| Symptom | First check | Conditions to isolate |
|---|---|---|
| Calibration will not complete or pass | Repeat the approved procedure with the correct fresh buffers | Old or contaminated buffer, a fouled electrode, reference-junction trouble, or declining sensor response |
| Response is slower than its documented baseline | Compare behavior in buffer and in the process | Fouling, a restricted junction, cold or low-ionic-strength water, or insufficient equilibration time |
| The value keeps moving in one direction | Compare pH and temperature over time | A real process change, temperature disequilibrium, electrode coating, or an unrepresentative measurement point |
| The value jumps or fluctuates | Check bubbles, immersion, connectors, cables, and the local display | A loose connection, damaged cable, trapped air, chamber pressure or flow, acquisition trouble, or a genuinely fast-changing process |
This table is a diagnostic map, not a replacement decision. One symptom can have several causes, so the next step is to establish a trustworthy reference.
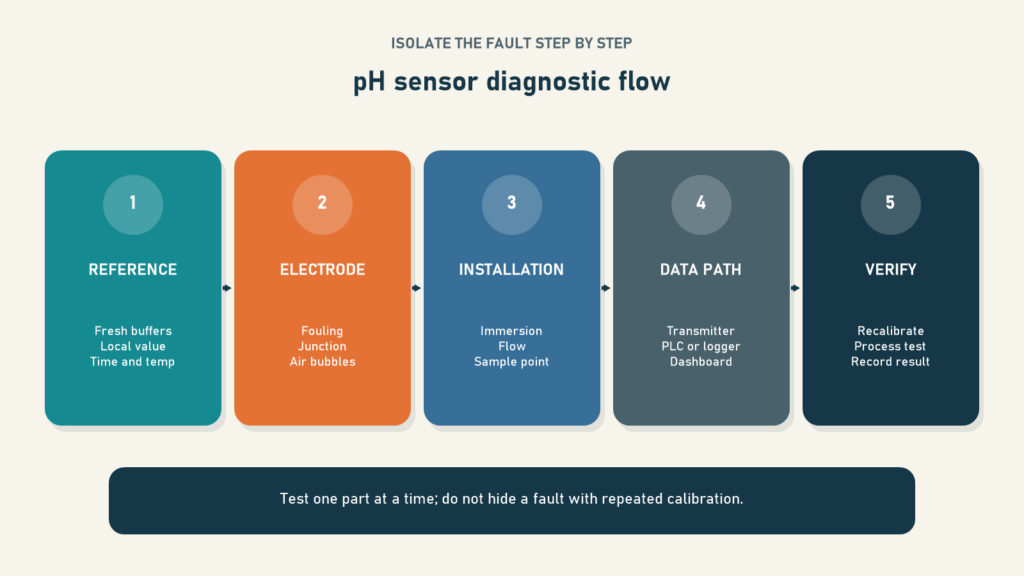
1. Establish a reference before recalibrating
Start by recording the conditions present when the fault appears: time, local pH value, PLC or data-logger value, dashboard value, temperature, pump or flow status, and the most recent cleaning or calibration activity. This snapshot helps separate an isolated disturbance from a recurring pattern.
Next, use in-date buffers approved for the instrument and procedure. For a two-point calibration, both the USGS manual and EPA Method 150.2 call for buffers that bracket the expected pH range. If the site procedure permits it, compare the online value with a maintained portable meter or a promptly measured grab sample taken near the sensor location.
The result gives the investigation its first branch. If the reading is unstable in the correct buffers, concentrate on the electrode, transmitter, connections, buffer handling, and calibration procedure. If buffer response is repeatable but the process value remains unreliable, continue with installation, sample conditions, and the acquisition chain.
2. Inspect the electrode and reference junction
Oil, fine solids, scale, and biological deposits can slow electrode response. Inspect the glass bulb or sensing surface, reference junction, protective guard, and filling-solution level when the installed electrode is a refillable design. Look for cracks, scratches, salt deposits, and any part of the assembly that is not immersed as intended.
Do not apply one cleaning recipe to every pH sensor. Electrode materials, junction designs, process chemistry, and fouling mechanisms vary. Use the method and cleaning agent approved by the sensor manufacturer and the site’s safety procedure; a treatment suited to oil may be unsuitable for mineral scale or biofilm. After manual cleaning, check the response and recalibrate according to the approved procedure before returning the sensor to service.
Air trapped against the bulb can also produce erratic readings. Confirm that the mounting orientation and flow do not continually hold bubbles at the measurement surface. Avoid aggressive wiping, scraping, or impact on a glass element in an attempt to force a faster response.
3. Check the measurement point, flow, and temperature
A healthy sensor can still produce misleading data when it is installed at an unrepresentative point. Confirm adequate immersion, clearance from the wall or floor, freedom from air pockets, and contact with water that represents the main process stream. In a flow chamber, review pressure, flow condition, and areas where deposits may accumulate.
Interpret temperature alongside pH. Automatic temperature compensation can correct the temperature-dependent electrical response of the electrode, but it does not remove a real change in the sample’s pH as temperature changes. A difference between two readings is therefore not automatically sensor drift when process temperature has also moved.
Very cold or low-ionic-strength water may also take longer to produce a stable response. Instead of forcing a universal time limit, compare the sensor with a documented baseline for the same water type, installation, and model.
4. Trace the value from the sensor to the dashboard
If the local value is stable while the central trend fluctuates, the fault is likely downstream of the sensing element. Compare the value at every point available to the team: local transmitter, PLC or data-logger input, network payload, and dashboard display.
For a 4–20 mA signal, inspect connectors and cable condition, then verify that the receiving channel uses the approved engineering scale. For RS485, check the physical connection and the project-approved communication configuration. Preserve the starting configuration and change one item at a time; otherwise, a troubleshooting session can introduce a second fault.
Differences between points narrow the search. When the transmitter and PLC agree but the dashboard does not, review data mapping, units, rounding, timestamps, and application-side transformations. When the value is already unstable at the transmitter, return to the sensor, mounting, power, and process conditions.
5. Verify the repair and build a sensor history
A repair is not complete because one reading has returned to normal. Repeat the reference check, confirm stable response across the relevant range, and observe the signal under normal process conditions. Record the action, conditions before and after, sensor identity, calibration result, temperature, and each part of the chain that was tested.
This history supports better maintenance decisions. The team can see whether slow response follows a particular fouling condition, whether instability appears after a process change, or whether one connection repeatedly creates bad data. Inspection and cleaning frequency can then be based on fouling risk and data-quality needs instead of a generic interval.
Argatech’s related article on environmental sensor calibration provides broader context, but the final procedure still needs to follow the installed model’s manual and the site’s approved requirements.
When should an integration team get involved?
Bring in the integration team when the fault changes between the local display and central system, when the mounting point is not representative, or when cleaning and calibration do not restore repeatable response. The most useful inputs are the connection diagram, sensor and transmitter models, process medium, operating range, installation photos, calibration log, and timestamped examples of the problem.
Fortuna Argatech can help review the measurement chain from sensor to dashboard and align the checks with actual site conditions. To discuss diagnosis, integration, or maintenance needs, contact the Fortuna Argatech team with the reference data already collected. That turns pH sensor troubleshooting from guesswork into a traceable isolation process.
Sources
- Measurement of pH, Techniques and Methods 9-A6.4, U.S. Geological Survey, revised February 2021.
- Method 150.2: pH, Continuous Monitoring (Electrometric) by pH Meter, U.S. Environmental Protection Agency, December 1982.
- pH Meter Sensor, Fortuna Argatech.
- SPARING, Fortuna Argatech.
Share this article
Share this insight with your team.
Related Articles
Similar topics from the same category.
Poor weather station placement can cause 50% data bias. Learn the WMO-No. 8 and Indonesian BMKG siting standards for AWS sensors in industrial and mining sites.
Explore a technical engineering comparison between solid-state ultrasonic anemometers and mechanical cup-and-vane sensors for industrial weather stations.

Technical guide to conductivity sensors: comparing toroidal (inductive), 2-electrode, and 4-electrode contacting probes for industrial water and wastewater.