Online Sensor Readings and Lab Results May Differ
Trace differences between online and laboratory data through six checks covering method, timing, samples, sensor condition, data processing, and acceptance.
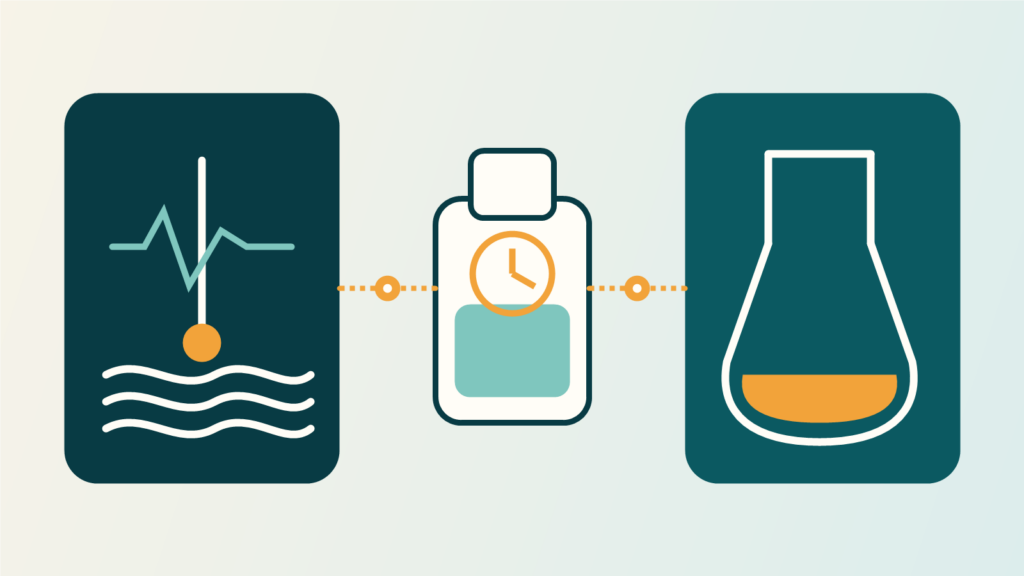
Online sensor readings and laboratory results can disagree without either value being automatically wrong. Before cleaning the probe or changing calibration, confirm that both numbers represent a comparable quantity, body of water, time, method, and sample condition.
A discrepancy becomes useful evidence only when the measurement paths are traceable. Otherwise, corrective work may target the sensor even though the difference entered through sampling location, bottle handling, analytical method, or data processing.
Why online sensor readings may not be comparable
A shared parameter name does not guarantee a like-for-like result. The comparison needs a defined quantity, water matrix, unit, method, temperature compensation, and reporting basis. In metrology, the quantity intended to be measured is the measurand. The JCGM International Vocabulary of Metrology also treats measurement uncertainty as part of deciding whether two results are compatible.
Turbidity and suspended solids provide a concrete example. Turbidity is an optical response commonly reported in NTU, while a solids analysis may report mass per volume in mg/L. The values cannot be compared directly or converted with one universal factor. USGS guidance explains that a turbidity-to-sediment relationship requires representative paired data and is generally site-specific.
Method differences can matter even when the units match. Check the laboratory method, preparation, working range, rounding, and any sensor compensation. The Argatech article on turbidity versus TSS provides further context on why the two measurements answer different questions.
Did the sensor and sample observe the same water?
A fixed sensor observes its installation point continuously, while a bottle captures one place and moment. If flow, mixing, depth, process stage, or water quality changes between those observations, both results may be valid for different conditions.
The USGS field-measurement guidance for water-quality properties calls for measurements that represent ambient conditions as closely as possible at the time of sampling. A paired check should record at least:
- the sensor timestamp, sampling time, and time zone;
- the sensor and bottle locations, including depth or pipe take-off point;
- flow, mixing, discharge, or process stage;
- reading stability before collection;
- operational events that could change the water during the comparison window.
One fixed point may not represent a poorly mixed cross-section. In the other direction, one grab sample cannot validate an entire continuous time series. The project data-quality objective should define how closely time and location need to align.
What happened between collection and analysis?
The sample continues to change after the cap is closed. Container type, preservative, storage temperature, air exposure, transport, laboratory receipt, preparation, and holding time can all determine whether the sample remains suitable for the selected method.
The EPA Quick Guide to Drinking Water Sample Collection shows that containers, preservation, and holding times depend on the parameter and method. Because that guide addresses drinking water, industrial and wastewater projects should follow the exact approved analytical method, laboratory instructions, permit conditions, and project quality procedure that apply to their samples.
Compare the field record with the laboratory report. Point identification, collection time, unit, method, receipt condition, dilution, and any qualification notes should agree before the laboratory value is treated as an equivalent reference.
Preserve sensor evidence before recalibrating
Cleaning or recalibrating immediately can remove the evidence needed to explain the discrepancy. Under sufficiently stable water conditions, record the reading before cleaning, after cleaning, and during the calibration check. The USGS continuous-monitor procedure uses that sequence to help separate fouling effects from calibration drift.
Inspect the sensing surface, mounting, local flow, cable, power, diagnostic status, and stabilization time. Deposits or coatings can slow a pH electrode, but a difference may also come from a poorly maintained reference, an unrepresentative installation point, or changing water during the check.
Use the exact device manual and project acceptance criteria. The Argatech guides to water-quality sensor maintenance and pH sensor troubleshooting can support the diagnostic sequence, but they do not replace model-specific procedures.
Trace the value from probe to dashboard
The number can change after it leaves the sensing element. A transmitter, datalogger, gateway, server, or dashboard may apply scaling, compensation, unit conversion, rounding, filters, or register mapping. Timestamps can also shift through time-zone settings, transmission delay, or the system’s storage convention.
In an Argatech ONLIMO system, parameters such as pH, dissolved oxygen, temperature, conductivity, and turbidity depend on sensor configuration and site requirements. The review therefore needs to follow the installed architecture rather than assume that every system uses one sensor set or data transformation.
When the project interface exposes them, compare the sensor or transmitter value, the logger record, the transmitted record, and the dashboard value. Confirm that units, decimals, compensation, register interpretation, multipliers, and timestamps refer to the same observation. Not every installation exposes every stage, so document which comparisons are actually available.
Run the comparison through six gates
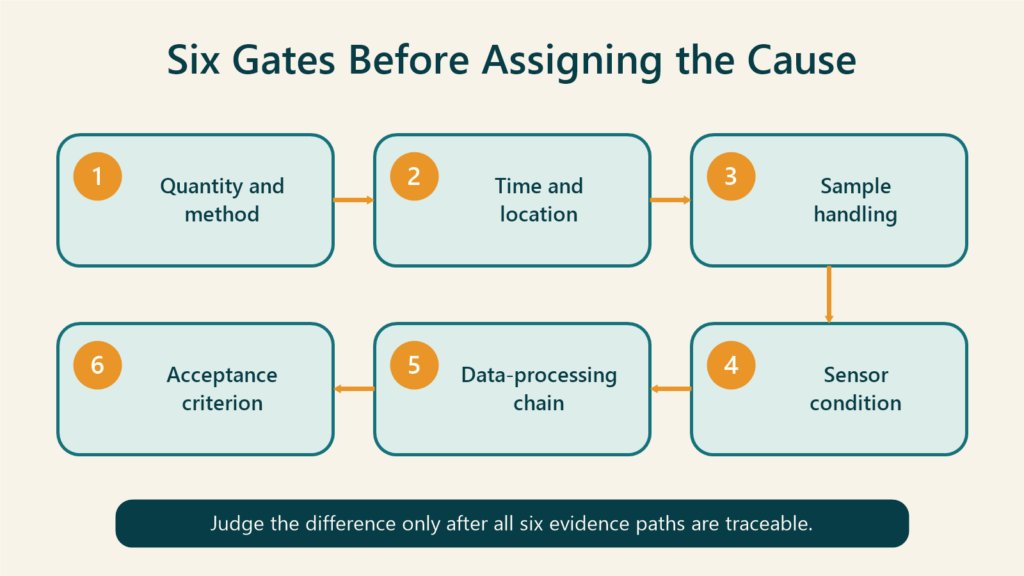
Use the following gates in sequence. The discrepancy is ready for judgment only after each gate has enough evidence.
- Quantity and method. Match the parameter, matrix, unit, measurement principle, compensation, laboratory method, and reporting basis.
- Time and location. Align timestamps and confirm that the sensor and bottle represent comparable water at the same point, depth, flow, and process condition.
- Sample handling. Verify the container, preservation, transport, receipt, preparation, and holding time required by the selected method.
- Sensor condition. Preserve records of stability, fouling, installation, reference checks, cleaning, and calibration without erasing the initial state.
- Data-processing chain. Where available, compare the transmitter, logger, server, and dashboard records, including scaling, units, rounding, and time handling.
- Acceptance criterion. Apply the approved tolerance, uncertainty basis, range, and decision rule for that parameter and project purpose.
No single percentage difference is acceptable for every parameter, laboratory, sensor, range, and application. The criterion must come from the method, data-quality objective, known uncertainty, and any relevant project or regulatory requirement.
Let the evidence determine the next action
Different findings require different responses:
- The difference disappears after time and location are aligned: improve the paired-sampling procedure and timestamp synchronization.
- The bottle or holding-time record is unsuitable: repeat sampling under the selected method and confirm requirements with the laboratory.
- The value changes after cleaning: document the fouling effect and review the maintenance interval.
- A clean sensor still disagrees with a valid reference: perform the approved verification or calibration procedure.
- The value changes between transmitter and dashboard: correct scaling, units, data mapping, or time processing after the configuration is verified.
- Both measurement paths are consistent while the water changes: investigate a real process or water-quality event rather than treating it as instrument noise.
Fortuna Argatech can help review the measurement point, sensor configuration, timestamps, scaling, and data path in a monitoring system. The laboratory method and acceptance criterion still need confirmation from the laboratory, process owner, and project quality plan. Bring the system diagram, model list, timestamped data, sampling record, analytical method, and cleaning and calibration history so the investigation can move beyond assumptions.
Share this article
Share this insight with your team.
Related Articles
Similar topics from the same category.
Poor weather station placement can cause 50% data bias. Learn the WMO-No. 8 and Indonesian BMKG siting standards for AWS sensors in industrial and mining sites.
Explore a technical engineering comparison between solid-state ultrasonic anemometers and mechanical cup-and-vane sensors for industrial weather stations.

Technical guide to conductivity sensors: comparing toroidal (inductive), 2-electrode, and 4-electrode contacting probes for industrial water and wastewater.