How to Configure Data Logger Scaling for 4-20 mA and Modbus Sensors
Configure data logger scaling correctly for 4-20 mA and Modbus sensors. Covers linear interpolation, register mapping, double-scaling traps, and verification.
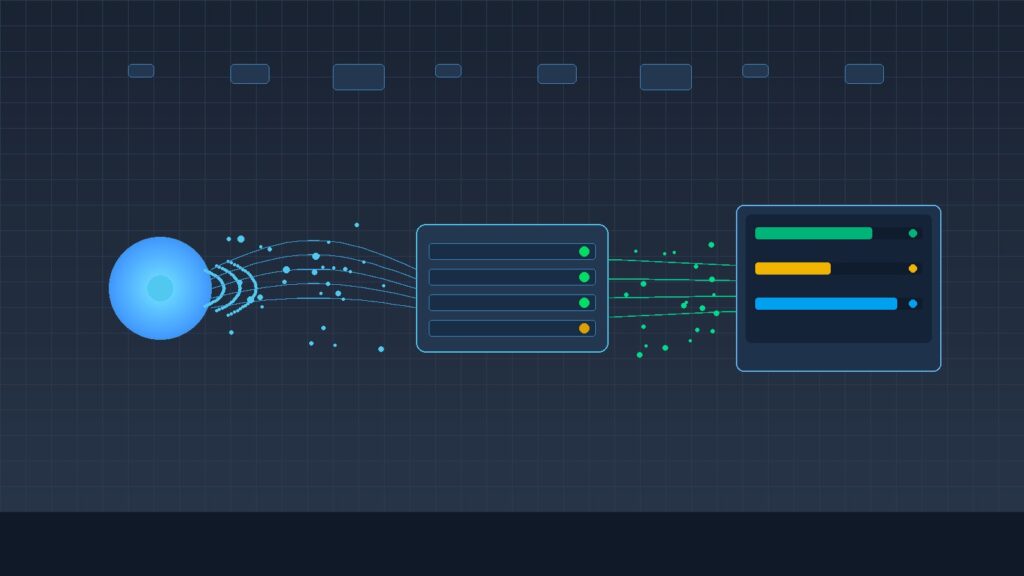
Every value on a monitoring dashboard (pH 7.2, turbidity 35 NTU, level 3.4 meters) depends on data logger scaling. The data logger converts a raw sensor signal into an engineering unit. Get the scaling formula wrong, use an incorrect register address, or mismatch the range limits, and the dashboard shows a number that looks perfectly normal but doesn’t represent the actual field condition. These errors almost never trigger alarms. The values stay within believable bounds, so nobody questions them.
This article covers how scaling works for analog (4-20 mA) and digital (RS-485 Modbus) signal paths, the configuration mistakes that produce silent errors, and how to verify everything before the system goes live.
What channel configuration controls
Each data logger channel maps one physical input (analog current, voltage, or digital register) to one engineering unit on the dashboard. You configure four things: input type (4-20 mA, 0-10 V, or RS-485 Modbus), lower and upper range values, conversion formula, and the output engineering unit (pH, NTU, mg/L, m, °C).
When any of those don’t match the sensor’s actual specification, you get a systematic error. The offset is consistent and looks credible, so it won’t trigger any alarm. That’s what makes it dangerous.
Data loggers such as the GEOVOS 1000 provide both RS485 and analog inputs, so the channel configuration must match the output type of each connected sensor. Exact steps depend on the data logger model and firmware version.
Analog scaling: converting 4-20 mA to engineering units
The IEC 60381-1 standard defines the 4-20 mA signal as a linear representation of the sensor’s measurement range. 4 mA corresponds to the lower range value. 20 mA corresponds to the upper. You calculate the engineering value with linear interpolation:
Engineering Value = ((Current − 4) / (20 − 4)) × (Range_High − Range_Low) + Range_Low
Here’s a real example: a pH sensor with a 0–14 range producing 12 mA should display pH 7.0. If someone enters the range wrong in the data logger (say 0–10 instead of 0–14), the same 12 mA signal displays pH 5.0. The number looks valid. It’s not. And nobody notices until someone dips a reference probe.
Range entry errors are hard to catch because the dashboard keeps showing values within a believable range. The only reliable way to find them is comparing the dashboard reading against a known physical reference.
One more thing. Current below 4 mA usually means a fault: wiring break, power loss, or sensor failure. It doesn’t mean the measurement is below range. Industry practice (NAMUR NE 43) defines the normal operating band as 3.8–20.5 mA, with anything outside it flagged as a fault. For more on the differences between analog and digital sensor outputs, see 4-20 mA vs RS-485.
Digital scaling: reading Modbus registers as real-world values
RS-485 sensors running the Modbus RTU protocol store measurement data in 16-bit registers. The data logger reads them using function code 03 (Holding Registers) or 04 (Input Registers) and converts the contents to engineering units.
You need to get four parameters right:
- Register address and function code. Point to the wrong address and you read a different variable entirely, or get a communication error.
- Data type and byte order. Floating-point values (IEEE 754) span two consecutive 16-bit registers, and the byte order matters. Get it wrong and the assembled value looks random, absurdly large, or shows up as NaN. I’ve watched technicians spend hours on this one because they assumed big-endian when the sensor used mid-endian word swap.
- Scale factor. Many sensors transmit raw integers that you divide by a documented factor. A register value of 735 with a scale factor of 100 means 7.35 pH. The sensor manufacturer’s register map tells you which factor to use.
- Register count and data width. Some sensors use a single 16-bit register for integer values, others use two registers for 32-bit floats. Misreading one register when you need two gives you half the data and a garbage result.
Every one of these parameters comes from the sensor documentation. Don’t guess. When Modbus communication itself is the problem (baud rate, parity, addressing), the Modbus RTU troubleshooting guide covers eight diagnostic checks for sensor networks.
The double-scaling trap
We see this mistake constantly. Double scaling happens when two devices in the signal chain, typically a transmitter and a data logger, each apply their own engineering unit conversion. The result looks believable but is mathematically wrong.
Example: a pH transmitter converts an electrode signal to a 4-20 mA output representing 0–14 pH. If the data logger also applies a 4-20 mA → 0–14 scaling formula to that signal, the conversion runs twice. The result isn’t a simple doubling; it’s whatever the formula produces when you feed already-converted data back through it.
The fix is simple: define exactly one conversion point in the signal chain.
- Transmitter converts: the output is already in engineering units, and the data logger records it as-is without additional scaling.
- Data logger converts: the transmitter sends a raw signal (current or raw integer), and the data logger applies the scaling formula.
Check the sensor documentation to find out whether the output is already in engineering units or still raw. Then configure accordingly.
Verifying configuration before going live
Configuration that looks correct on paper doesn’t guarantee correct readings on the dashboard. You need to compare the dashboard value against a known physical reference. There’s no shortcut here.
A basic verification procedure:
- Apply a known reference input. For analog channels, use a current calibrator to inject a specific mA value. For digital channels, use a verified sensor or a certified standard solution. This mirrors the methodology used when comparing online sensor readings to laboratory results.
- Check at least two points within the measurement range. Don’t just test zero and span endpoints. Testing near 25% and 75% of range confirms scaling linearity, not just whether the endpoints land correctly.
- Document the scaling chain for each channel. Record the sensor model, output type, range, register address (if Modbus), scaling formula, and displayed unit. This documentation is what keeps the next technician from redoing your work six months later. Without it, every maintenance visit starts from scratch.
These steps belong in the commissioning process. Do them alongside other commissioning checks, not as an afterthought once the system is already feeding data to stakeholders.
When the dashboard value still does not match
If the dashboard reading stays wrong after you’ve verified the channel configuration, the problem is probably outside scaling. Several conditions produce similar symptoms:
- Sensor condition. Fouling, drift, or physical damage changes the sensor output even when the channel configuration is correct.
- Installation. Sensor position, orientation, or flow conditions affect the measurement at its source. I’ve seen a pH reading off by 0.8 units because the sensor was mounted in a dead zone with no flow.
- Process conditions. Changes in sample matrix or temperature shift the sensor response in ways that scaling can’t account for.
- Transmission path. Cable faults, connector corrosion, or electromagnetic interference corrupt the signal before it reaches the data logger.
Ruling out scaling first saves you real troubleshooting time. If the scaling is verified correct but readings still deviate, investigate sensor data quality and physical installation conditions. Don’t waste time reconfiguring the channel.
For help with data logger scaling, channel configuration, or monitoring system integration, contact the Fortuna Argatech technical team.
Share this article
Share this insight with your team.
Related Articles
Similar topics from the same category.

Poor weather station placement can cause 50% data bias. Learn the WMO-No. 8 and Indonesian BMKG siting standards for AWS sensors in industrial and mining sites.

Explore a technical engineering comparison between solid-state ultrasonic anemometers and mechanical cup-and-vane sensors for industrial weather stations.

Technical guide to conductivity sensors: comparing toroidal (inductive), 2-electrode, and 4-electrode contacting probes for industrial water and wastewater.