Modbus RTU Troubleshooting: 8 Checks for Sensor Networks
A practical sequence for diagnosing Modbus RTU timeouts, CRC errors, exception responses, and incorrect sensor values without random rewiring.
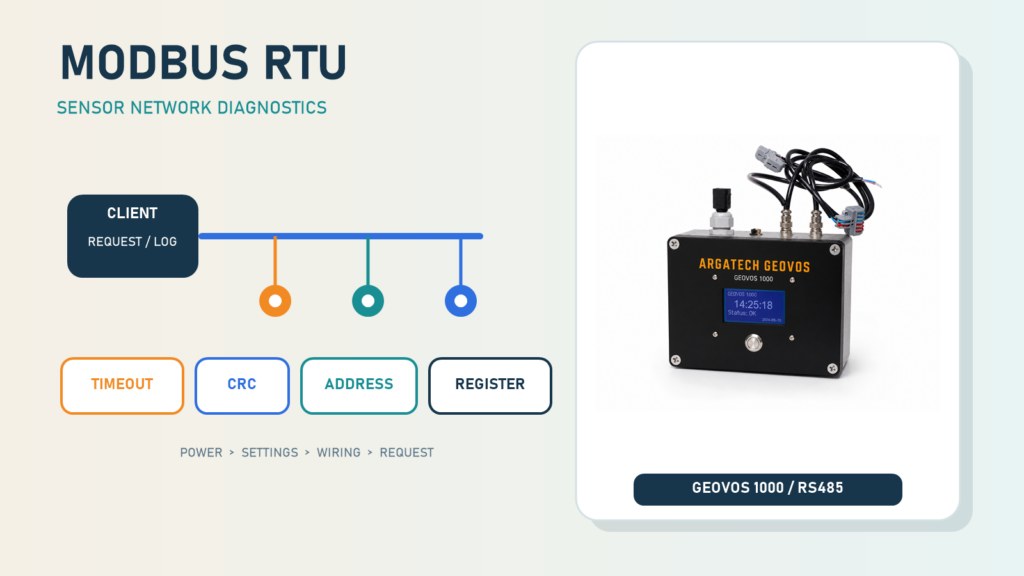
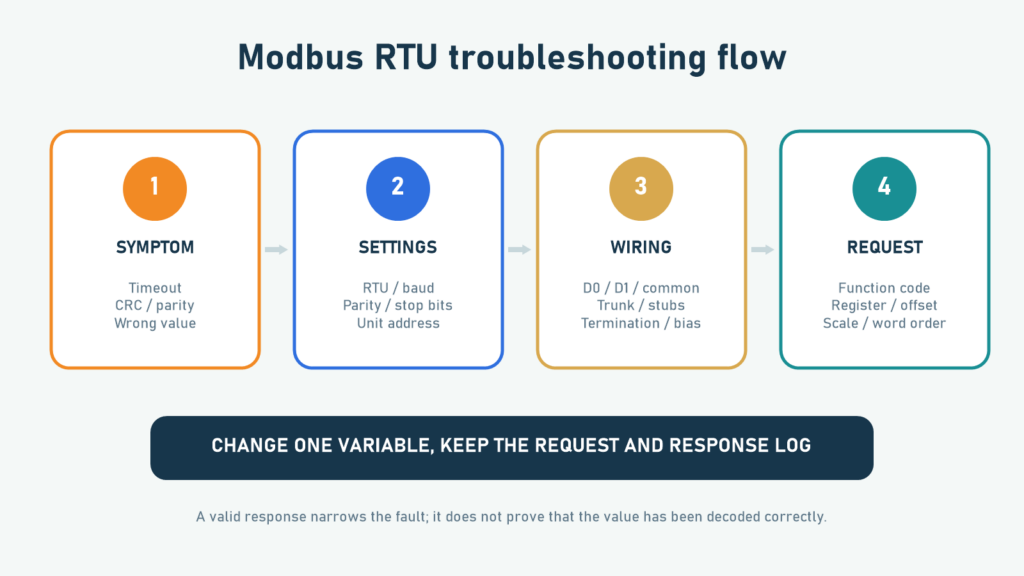
Modbus RTU troubleshooting works best in a fixed order: confirm power, inspect the RS-485 path, match the serial settings, and then validate the device address and register request. This sequence keeps a team from replacing sensors, adding terminators, or swapping conductors without enough evidence.
Communication symptoms should also be separated. A timeout means the client did not receive a usable reply. CRC or parity errors indicate that data arrived but the frame failed its checks. An exception response means the device understood enough of the Modbus frame to reject or fail a particular request.
The system context still matters. The GEOVOS 1000 data logger page lists RS485 support, while the Turbidity Sensor page lists RS485 Modbus communication. Those published interfaces establish a relevant integration context, but they do not replace the serial manual and register map for the exact models installed.
Modbus RTU troubleshooting starts with the symptom
The official MODBUS over Serial Line Specification and Implementation Guide V1.02 describes an RTU frame containing an address, function code, data, and CRC. A client sends a request and waits for a reply from the addressed device. The type of response therefore helps narrow the layer that should be inspected first.
| Symptom | Initial meaning | First checks |
|---|---|---|
| No response or timeout | No valid reply arrived before the timeout | Power, port, RTU mode, baud rate, parity, address, and conductors |
| CRC or parity errors | Data arrived, but frame validation failed | Serial settings, noise, connections, topology, grounding, and timing |
| Exception 01, 02, 03, or 04 | The device replied but could not execute the request | Function code, register, quantity, request value, and device state |
| A value is readable but implausible | Communication may work while data interpretation is wrong | Offset, data type, signedness, scale, byte order, and word order |
| One device works but the network fails | The problem appears after more nodes are connected | Duplicate addresses, trunk and stubs, termination, bias, loading, and timeout |
This table is a starting point, not a final diagnosis. One symptom can have several causes. Change one variable at a time and record the result.
Eight checks before replacing a device
1. Confirm power and the physical port
Start with what can be measured or observed. Check supply voltage at the device terminal against its manual, indicator status, protection or fusing, and the port selected by the client. Confirm that the software or data logger is opening the RS-485 port connected to the network rather than another port carrying an old configuration.
Do not label a sensor defective simply because it does not reply. A device that repeatedly restarts, a supply that drops under load, or an unpowered converter can all look like protocol faults.
2. Match conductors to both device manuals
Check D0/D1, A/B, common, shield, and connector pinout against the documentation at both ends. Vendors do not always use A and B labels with the same convention, so swapping the pair should be a controlled test only after the original condition and manuals have been recorded.
Inspect loose terminals, unplanned branches, untwisted sections, and shield or common connections that differ from the design. Do not change grounding on an energized system without review by a qualified technician.
3. Match the serial mode and parameters
The client and devices on a segment need compatible settings: RTU or ASCII mode, baud rate, data bits, parity, and stop bits. RTU framing also uses timing to identify frame boundaries. A mismatch can produce timeouts, parity errors, or traffic that is never accepted as a complete frame.
Copy settings from the actual manual and configuration rather than memory. When a USB-to-RS485 converter is used for testing, verify that another application is not holding the same serial port.
4. Give every device a unique unit address
The serial-line guide assigns individual addresses from 1 to 247 and reserves address 0 for broadcast. Two devices using the same unit address can reply at the same time or make the bus behave unpredictably.
Test one device first, record its address, and add the next node gradually. Do not interpret the logical address range as proof that 247 physical devices are safe on one segment. Transceiver loading, cable characteristics, topology, and repeaters also set practical limits.
5. Inspect the trunk, stubs, termination, and bias
The guide describes a trunk with devices connected in a daisy chain or through short derivations. Line terminations belong at the two trunk ends for impedance matching. Adding a terminator to every node can overload the network instead of improving it.
Some clients or devices provide line polarization, also called bias. When required, the guide places it at one location for the serial bus. Check the equipment documentation before adding resistors because the gateway or data logger may already provide the function.
6. Verify the function code and register address
The MODBUS Application Protocol Specification V1.1b3 separates coils, discrete inputs, input registers, and holding registers through function codes. A correct-looking register queried with the wrong function code may produce exception 01 or 02.
Address display conventions also matter. Protocol Data Unit addresses start at zero, while a manual or software tool may show references such as 40001 or use one-based notation. If the device returns Illegal Data Address, compare the function code, starting address, and register quantity with a tested request example from its manual.
7. Decode the data using the register map
A valid response is not necessarily a correct engineering value. Confirm whether the register contains a signed integer, unsigned integer, floating-point value, status bits, or part of a 32-bit value. Apply only the scale and units published by the manufacturer.
For values spanning more than one register, verify byte order and word order in the device manual. Modbus defines 16-bit registers, but the arrangement of longer values must be confirmed for the device.
8. Preserve request and response evidence
Record the timestamp, unit address, baud and parity, function code, starting address, quantity, raw data, exception code, timeout, and CRC counters when available. This evidence is more useful than a short report saying only that a sensor is offline.
When isolation is necessary, test one client and one device over a short known-good cable, then rebuild the network gradually. Do not change the address, wiring, timeout, and register map together because the result will not identify which change resolved the fault.
Connect the diagnosis to the monitoring system
Serial communication is only one layer. After a register is read, the data logger or PLC still has to apply scaling, timestamps, quality flags, polling intervals, storage, alarms, and dashboard transmission. A correct value in a test tool does not prove that the complete monitoring chain is configured correctly.
If the sensor interface is still being selected, the 4-20 mA vs RS485 guide helps frame that decision before integration. For a protocol foundation, review why many sensors use RS485 Modbus.
Fortuna Argatech can help review device allocation, client ports, serial settings, register maps, data loggers, and the data path to the dashboard as one configuration. When contacting the Fortuna Argatech team, include device models, the wiring diagram, serial parameters, unit addresses, register requests, and response or timeout logs so everyone starts from the same evidence.
Technical sources
- MODBUS over Serial Line Specification and Implementation Guide V1.02, Modbus.org, December 20, 2006.
- MODBUS Application Protocol Specification V1.1b3, Modbus Organization, April 26, 2012.
Share this article
Share this insight with your team.
Related Articles
Similar topics from the same category.

Poor weather station placement can cause 50% data bias. Learn the WMO-No. 8 and Indonesian BMKG siting standards for AWS sensors in industrial and mining sites.

Explore a technical engineering comparison between solid-state ultrasonic anemometers and mechanical cup-and-vane sensors for industrial weather stations.

Technical guide to conductivity sensors: comparing toroidal (inductive), 2-electrode, and 4-electrode contacting probes for industrial water and wastewater.