Flow Cell and Sample Conditioning: Keeping Online Sensors Reading the Right Water
Flow cell water quality sensor design guide: dead volume, transport lag, per-parameter flow rates, and sample conditioning system maintenance.
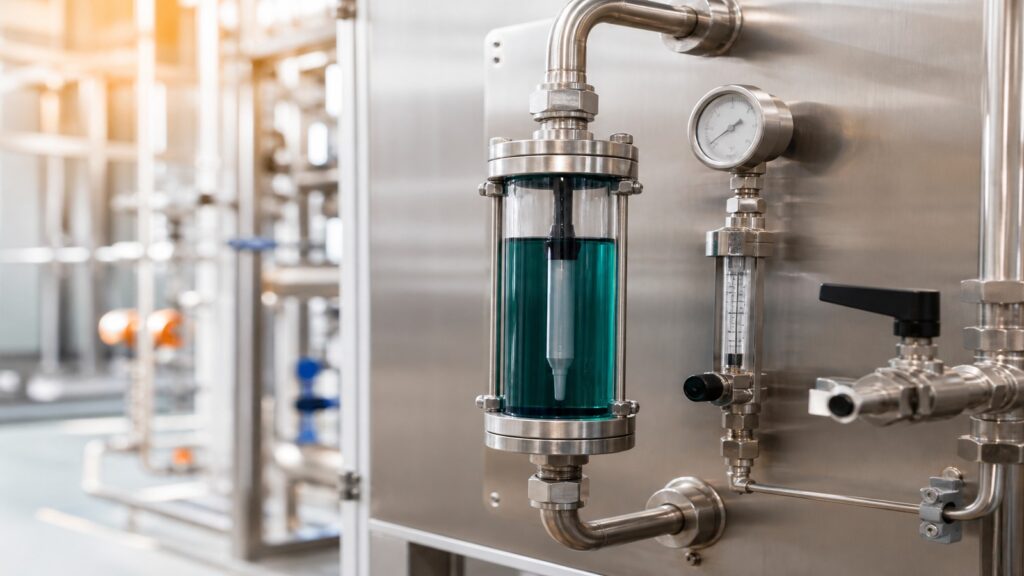
A pH sensor that passes calibration in the lab can still produce readings that have nothing to do with the actual water at the discharge point. The sensor itself is fine. The problem is what happens between the sampling tap and the measurement window. A pipe that is too long holds several minutes of stale water before the sample ever reaches the probe. Dead volume inside the flow cell traps old sample while conditions outside have already shifted. Air bubbles entering the tubing register as particles on an optical sensor, spiking turbidity readings with no real change in water quality.
None of these problems trigger an instrument error. The data logger keeps logging, the dashboard keeps displaying, and the compliance server keeps receiving. All of it based on water that no longer represents what is actually flowing through the outfall. ASTM D5540-13(2021) is explicit on this point: the sample must not be altered during transport and conditioning. Designing the path from sampling point to flow cell water quality sensor is just as critical as selecting the right probe. The components, design factors, and maintenance practices below determine whether a sample conditioning system quietly undermines your data or delivers readings you can defend.
When You Need a Sample Conditioning System
Not every sensor installation requires a flow cell. USGS TM 1-D3 documents three monitoring configurations: flow-through in a shelter, in-situ (direct submersion), and internal-logging. Each carries different trade-offs.
A flow-through setup protects the sensor inside a shelter, simplifies calibration access, and allows integration with disinfection systems. The downside is that pumping can alter water quality. Dissolved oxygen and other pressure- or temperature-sensitive parameters are particularly vulnerable. For a side-by-side comparison of installation methods, see the article on water quality sensor installation. One regulatory note for operations in Indonesia: PermenLHK P.93/2018 Annex I specifies direct immersion as the measurement method for SPARING. Operators who choose a flow cell or bypass configuration should confirm method acceptance with the relevant regulatory authority before installation.
Key Components of a Sample Conditioning System
A typical sample conditioning architecture (synthesized from ASTM, USGS, EPA, and vendor documentation) runs through these stages in sequence:
Sample take-off point is where water is diverted from the process pipe or waterbody. Its location determines whether the sample is representative of the stream being monitored.
Strainer or filter sits upstream of the flow cell to intercept debris that could foul sensor surfaces or block narrow passages. Mesh size depends on what the sensor needs. The E+H CCA250 flow assembly, for example, requires a 500 um dirt trap upstream. At the other end of the spectrum, the E+H CAT860 automatic conditioning system uses a 0.1 um ceramic filter for reagent-based analyzers.
Debubbler removes entrained air before it reaches the measurement chamber. This is especially important for optical sensors. Air bubbles inside a turbidity flow cell register as particles, producing false spikes indistinguishable from actual water quality changes.
Pressure regulator protects the flow cell when sample pressure exceeds the assembly’s rating. The E+H CCA250, for reference, is rated to a maximum of 4 bar at 40 degrees C.
Flow control valve or rotameter maintains a constant flow rate through the cell according to the sensor manufacturer’s specification. Fluctuating flow causes variable response times and unstable readings.
Flow cell houses the sensor probe in a controlled measurement environment. Water enters, passes across the sensing element, and exits to drain.
Three Design Factors That Determine Representativeness
Dead volume and turnover time. Dead volume is the water sitting inside the flow cell at any given moment. The larger it is, the longer stale sample lingers while conditions outside have already changed. Turnover time is simply cell volume divided by flow rate. The YSI EXO2 has an internal volume of roughly 925 mL. At 500 mL per minute, a complete sample replacement takes about 1.85 minutes. Reducing cell volume or increasing flow rate shortens turnover, but the flow rate must stay within the sensor’s recommended operating range.
Transport lag. This is the time the sample needs to travel from the take-off point to the sensor. ISO 15839:2003 defines it as part of the total system delay time. The calculation is straightforward: pipe volume divided by flow rate. Longer pipes with larger diameters mean longer lags. To put numbers on it: the E+H CAT860 uses 2 mm ID tubing. At a filtrate rate of 5.5 to 16.5 mL/min through 30 meters of that tubing, the transport lag reaches 6 to 18 minutes. Vendor guidance is consistent: keep lines as short and as narrow as practical.
Flow velocity in transport piping vs. inside the flow cell. ASTM D5540 recommends 1.8 plus or minus 0.2 m/s inside the transport pipe to minimize deposition of ionic and particulate material on pipe walls. Inside the flow cell, velocity drops considerably to match the sensor’s measurement requirements. Membrane or galvanic dissolved oxygen sensors, for instance, need a minimum water velocity of 0.3 m/s at the measurement point for adequate oxygen diffusion across the membrane.
Recommended Flow Rates by Sensor Type
| Sensor / Flow Assembly | Flow Rate | Source |
|---|---|---|
| E+H CCA250 (disinfection) | Optimum 30 L/h, range 30–120 L/h | E+H CCA250 TI |
| E+H CYA27 multiparameter (5 L) | Min 5 L/h | E+H CYA27 TI |
| E+H CYA27 multiparameter (30 L) | 30–40 L/h | E+H CYA27 TI |
| YSI EXO flow cell | 100 mL–1 L/min; vertical mount; inlet at bottom | YSI EXO Manual |
| DO sensor (membrane/galvanic) | Water velocity >= 0.3 m/s at measurement point | USGS TM 1-D3 |
| Transport piping (not flow cell) | 1.8 +/- 0.2 m/s | ASTM D5540 |
This table is a starting reference. Always check the specific technical documentation for the sensor you are installing. An incorrect flow rate can accelerate fouling or noticeably slow response time.
Maintaining the Sample Conditioning System
A sample conditioning system is not a set-and-forget installation. Strainers and flow cells need periodic cleaning. How often depends entirely on the particulate load at the site. Wastewater with high suspended solids can clog a strainer within days, while relatively clean surface water may go weeks between cleanings.
Tubing degrades over time. Biofilm colonizes the inner walls, plasticizer leaches into the sample stream, and the effective internal diameter narrows. Periodic replacement reduces the risk of cross-contamination between successive samples and keeps transport lag predictable.
For installations in remote or difficult-to-access locations, automated conditioning systems such as the E+H CAT860 support backflushing with compressed air and chemical cleaning. This extends the interval between field visits, though it does not eliminate the need for visual inspection.
Checking flow rate with a rotameter should be part of every routine maintenance visit. A declining flow rate without any valve adjustment usually points to a strainer or tubing blockage, and until it is cleared, the sensor is reading old water.
Flow cell and sample conditioning design is one link in the chain between the sampling point and the compliance dashboard. Articles on sensor cleaning schedules, sensor data quality flags, and SPARING systems cover adjacent topics that complete the picture. Without all of them working together, the data reaching the server says nothing about the water leaving the outfall.
Share this article
Share this insight with your team.
Related Articles
Similar topics from the same category.
Poor weather station placement can cause 50% data bias. Learn the WMO-No. 8 and Indonesian BMKG siting standards for AWS sensors in industrial and mining sites.
Explore a technical engineering comparison between solid-state ultrasonic anemometers and mechanical cup-and-vane sensors for industrial weather stations.

Technical guide to conductivity sensors: comparing toroidal (inductive), 2-electrode, and 4-electrode contacting probes for industrial water and wastewater.