Wiper, Copper, or UV? How to Choose an Antifouling Strategy for Water Quality Sensors
Five antifouling strategies for submersible water quality sensors (copper, wiper, UV, coating, and biocide) with a per-parameter selection matrix.
Biofouling doesn’t announce itself. A sensor that reads accurately on Monday can report values 15% low by Friday, because biofilm growing on the optical window absorbs part of the light beam before it reaches the detector. There’s no hardware alarm, no error code. The only thing that changes is the number on the dashboard, and the discrepancy often goes unnoticed until the next site visit. Choosing the right antifouling water quality sensor strategy before deployment is the difference between trustworthy data and slow, invisible drift.
This isn’t a theoretical concern. An evaluation of 16 ONLIMO stations operated by BPPT/KLHK between 2014 and 2019 identified biofouling on multiprobe sensors as the primary operational problem (Robbani & Wahjono 2019, JAI/BPPT). Before settling on an antifouling approach, it pays to understand how fouling develops and which parameters are most at risk.
How Biofouling Develops on Submersible Sensors
The fouling process starts faster than most operators expect. The moment a sensor is submerged, its metal and optical surfaces are exposed to microorganisms in the water column. A conditioning film (a thin layer of proteins and organic molecules) begins adhering within minutes, and initial bacterial colonies can establish in under one hour (Delgado et al. 2021; Robbani & Wahjono 2019). Once that base layer is in place, algae and larger organisms attach on top, building a multi-layered biofilm that thickens over time.
How fast that biofilm grows depends on water temperature, nutrient concentration, organic matter load, and light availability. Warmer, nutrient-rich water accelerates colonization sharply (Delgado et al. 2021). In tropical waters, including most rivers and reservoirs in Indonesia, this means fouling rates are higher than in temperate waters. Year-round biological productivity with no winter dormancy narrows the maintenance window unless a preventive strategy is already in place.
Which Sensor Types Are Most Vulnerable
Not all sensors are affected equally. Optical sensors (turbidity, optical dissolved oxygen (DO), and UV-COD) are the most vulnerable. Biofilm on the optical window directly attenuates the light beam the sensor sends and receives. In a Campbell Scientific field test, an unprotected OBS sensor experienced baseline drift within the first 3 days of deployment (Campbell Scientific, biofoul-prevention paper). Every additional layer of biofilm adds false absorbance that the sensor interprets as a change in concentration.
Electrochemical membrane sensors (amperometric DO and pH) are affected through a different mechanism. Biofilm clogs the membrane surface and interferes with the ion exchange required to produce a signal (Delgado et al. 2021). The result is a reading that gradually slows in response time, then begins deviating from the actual value.
Conductivity sensors are generally the least vulnerable among common parameters. Their open electrode design makes it harder for biofilm to attach evenly. Still, biofilm accumulation on electrode surfaces can shift calibration over time, particularly in environments with high organic loads.
Five Antifouling Strategies and When to Apply Them
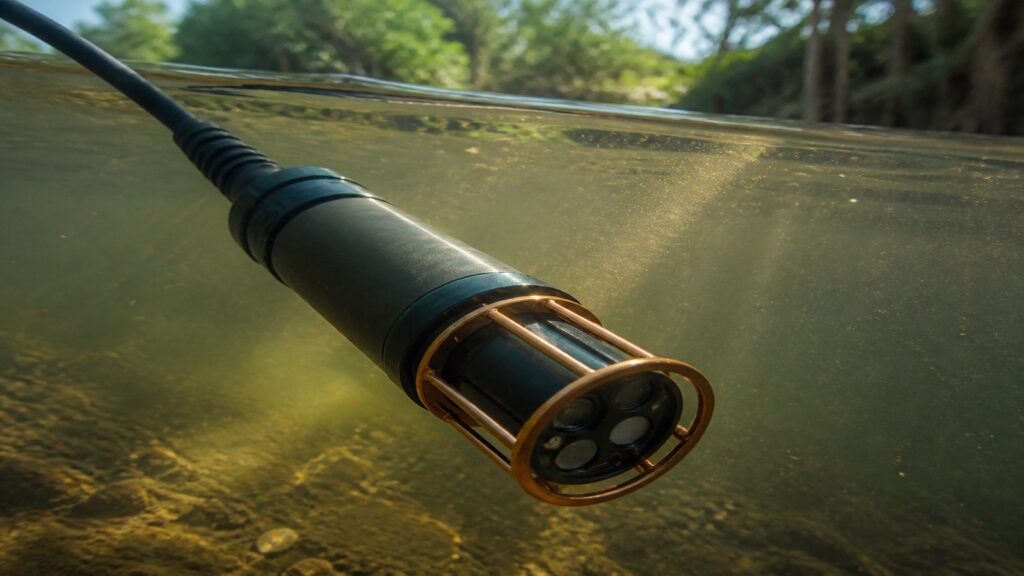
Copper alloy components (guards, tape, or port plugs made from copper) work by releasing Cu²⁺ ions that are toxic to fouling organisms (Delgado et al. 2021; YSI E108; Matos et al. 2023). The approach is passive, has no moving parts, and is effective across most sensor types. One important caveat: if the monitoring station also measures dissolved copper, the ions released from the protective components can interfere with that measurement (EPA Water Sensors Toolbox). Check that monitored parameters don’t conflict before installing copper-based components.
Mechanical wipers physically clean the optical window at programmed intervals, typically every 15 minutes to several hours, depending on the environment. This strategy is most effective for optical sensors (turbidity, optical DO, UV-COD) because it directly addresses the root cause: biofilm on the optical surface (YSI E108; Campbell Scientific). Wipers do require their own maintenance: motors, brushes, and seals need periodic inspection and replacement. But the benefit of extended deployment intervals usually justifies the overhead. In field prototypes, wiper-equipped sensors maintained usable readings through 6+ months of deployment versus the 3-day baseline drift seen without protection.
UV protection (UV-LED or UV windows) works by photoinhibiting algal attachment on optical surfaces (Delgado et al. 2021). Robbani & Wahjono (2019) evaluated UV-LED as one of several biofilm prevention strategies for ONLIMO sensors in Indonesia. UV protection is most relevant for optical sensors in environments with high algal growth, and it is often combined with a wiper for layered defense.
Antifouling coatings (PDMS, self-polishing coatings) provide passive resistance to organism attachment without moving parts. The advantage: no additional power draw or mechanism required. The drawback: field performance varies, and coatings require periodic reapplication as their effectiveness degrades over time (Delgado et al. 2021; Sahoo et al. 2025). Coatings work best as a supplementary layer, not as the primary defense for high-risk sensors.
Biocide / chlorine injection has proven effective in field trials. In a 48-day comparison of six antifouling techniques in marine conditions, chlorine- and copper-based approaches ranked highest (Matos et al. 2023). Biocide injection works well inside enclosed flow cells at monitoring shelters or cabins. However, it is not suitable for open-water submersible deployments without containment, because the chemical disperses before it can act effectively (Delgado et al. 2021).
Per-Parameter Strategy Matrix
| Parameter | Vulnerability | Recommended Strategy | Notes |
|---|---|---|---|
| Turbidity (optical) | Very high | Mechanical wiper + copper components | Most effective combination for optical sensors |
| Optical DO | Very high | Mechanical wiper + UV or coating | Avoid copper if monitoring dissolved copper |
| Membrane DO | High | Copper components + scheduled membrane replacement | Copper protects exterior; membrane still needs replacement |
| pH (membrane) | High | Copper components + coating | Wipers generally not available for pH sensors |
| UV-COD | High | Mechanical wiper + UV window | Biofilm on UV window affects absorbance |
| Conductivity | Low–medium | Copper components sufficient | Wiper rarely needed; inspect electrodes during calibration |
Sources: Delgado et al. 2021 (MDPI Sensors), Matos et al. 2023, Campbell Scientific. Strategy choice depends on site conditions and feature availability on the sensor model in use.
Antifouling and Maintenance Scheduling
Without antifouling measures, the interval between maintenance visits is dictated by how quickly sensor readings drift past acceptable tolerance limits. USGS TM 1-D3 defines fouling correction procedures by comparing initial readings (potentially fouling-contaminated) against readings taken after the sensor is cleaned. The difference forms the basis for linear correction across the inter-visit period.
In the Indonesian regulatory context, that tolerance is more than a best practice: it’s an obligation. SPARING regulations (PermenLHK P.93/2018, as amended by P.80/2019) require accuracy of pH ±0.1 and COD/TSS/NH₃-N/flow rate ±10%. Fouling that degrades sensor accuracy beyond these thresholds is a direct compliance risk for Indonesian industrial operators. For ONLIMO systems, readings distorted by biofouling flow into the KLHK dashboard without an automatic flag that drift has occurred, meaning reported data may no longer represent actual conditions.
The right antifouling strategy can extend visit intervals, but the exact extension depends on the site-specific fouling rate, which is shaped by temperature, turbidity, nutrient load, and current speed. The first deployment cycle should be used to validate how far intervals can realistically stretch at a given location. Sensor manufacturers such as YSI, Campbell Scientific, and Sea-Bird integrate antifouling features as options or built-in capabilities; availability varies by model and should be verified against the sensor’s specifications.
Fouling is the upstream problem in the entire data-quality chain. Once an antifouling strategy is installed, data flagged by the validation system should still be checked for drift patterns, because antifouling slows degradation, it does not eliminate it entirely. A physical cleaning schedule remains necessary; what changes is the frequency. Further guidance on determining when to clean sensors and configuring installations that minimize fouling exposure is available as supplementary reference.
Share this article
Share this insight with your team.
Related Articles
Similar topics from the same category.

Poor weather station placement can cause 50% data bias. Learn the WMO-No. 8 and Indonesian BMKG siting standards for AWS sensors in industrial and mining sites.

Explore a technical engineering comparison between solid-state ultrasonic anemometers and mechanical cup-and-vane sensors for industrial weather stations.

Technical guide to conductivity sensors: comparing toroidal (inductive), 2-electrode, and 4-electrode contacting probes for industrial water and wastewater.