Dam Seepage Monitoring with V-Notch Weirs: ISO 1438 Hydraulic Design, Kindsvater-Shen Formula, and Automated Level Telemetry
A comprehensive engineering guide to ISO 1438 V-notch weir hydraulic design and automated telemetry level sensors for dam seepage monitoring.
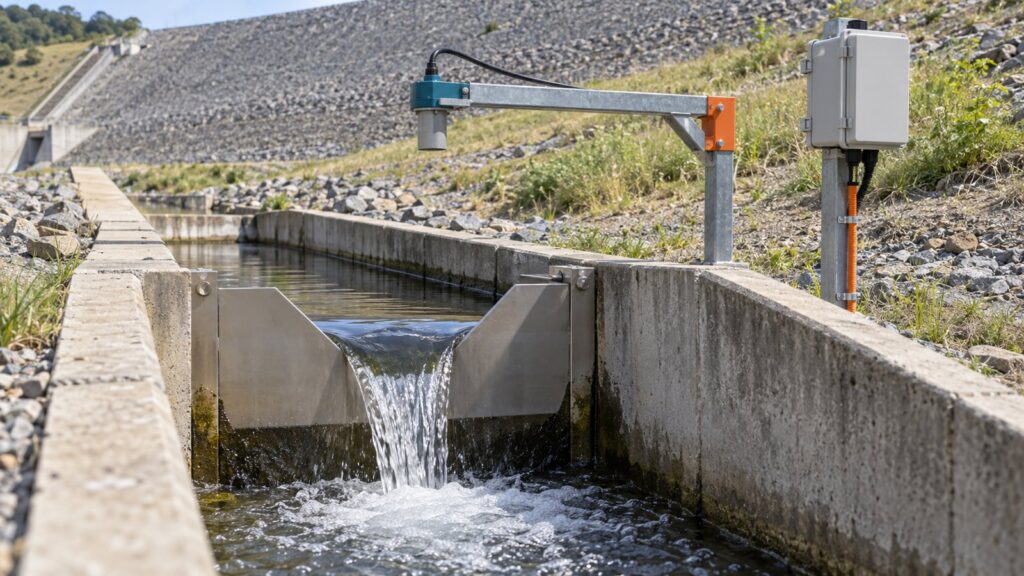
Has the seepage discharge at your downstream toe drain spiked after a reservoir fill or a seismic event? If it has, you have a problem. Sudden seepage increases are the first warning sign of internal erosion (piping). That failure mechanism causes over 40% of embankment dam failures worldwide. ICOLD and FEMA have the data to prove it. Despite this, I still see field crews measuring seepage manually with a bucket and a stopwatch in cramped inspection galleries. It is a safety hazard for site personnel. Worse, it is far too slow for any real early warning. Dam safety engineers in Indonesia have to comply with public works regulation Permen PUPR No. 27/PRT/M/2015 and mining mandate Kepmen ESDM No. 1827 K/30/MEM/2018. That means continuous, reliable seepage monitoring is not optional. You need a properly designed dam v-notch weir built to ISO 1438 standards. I am going to explain how to select the right notch angle, apply the Kindsvater-Shen formula, stop clinging nappe errors, and deploy non-contact ultrasonic level sensors linked to telemetry edge dataloggers.
Why Seepage Monitoring is the First Line of Defense for Dam Safety
Earthfill embankment dams and mining tailings storage facilities are just massive piles of engineered dirt holding back millions of cubic meters of water. Water is lazy and heavy. It will always find a way to seep through the core and foundation. That base seepage is normal. The real problem starts when this flow carries away the fine clay particles of the dam core. We call that internal erosion, or piping.
If you do not detect internal erosion, the migrating soil particles leave voids behind. The embankment slope will eventually collapse. Seepage changes give you the earliest physical indicator of a slope failure. You need continuous discharge monitoring. A sudden increase in seepage without a corresponding rise in the reservoir pool level means the internal structure is already compromised. Do not wait for daily or weekly manual bucket measurements. By the time you read those numbers, you have already missed the window to activate emergency drawdown protocols.
Dam V-Notch Weir Hydraulic Anatomy: Free Flow and the Clinging Nappe Hazard
Inspection galleries and seepage collection channels usually handle small flows under 100 liters per second (L/s). A thin-plate triangular weir is the global hydrometry standard for these conditions. A dam v-notch weir is incredibly sensitive. The discharge rate increases exponentially to the power of 5/2 relative to the water head ($h$).
ISO 1438:2017 sets strict geometric tolerances for the stainless steel weir plate. You cannot just guess these dimensions. The crest bevel (the sharp edge of the notch) must have a thickness between 1 mm and 2 mm. Cut the downstream face of this bevel at an angle between 45° and 60°. This sharp edge is non-negotiable. It forces the water to detach cleanly from the plate. I have seen too many bad field fabrications ruin otherwise good monitoring setups.
The “clinging nappe” is the most common field error in dam seepage measurement. It happens when the water curtain clings to the downstream face of the weir plate. Poor aeration or a blunt crest edge usually causes this. It creates a sub-atmospheric suction beneath the nappe. This negative pressure pulls more water over the crest than the hydraulic head alone dictates. The result is a massive overestimate in discharge readings. The data skews 15% to 25% higher than reality. You need a fully aerated free nappe. ISO 1438 and the USBR Water Measurement Manual demand a minimum vertical drop of 50 mm to 100 mm from the notch vertex to the downstream tailwater surface. You also need adequate side ventilation. Do it right the first time.
Selecting the Notch Angle: 90°, 60°, 120°, or 45°
Selecting the right notch angle is a trade-off between flow capacity and head sensitivity. You want enough resolution for the level sensor to catch minor flow changes. But you also need enough capacity so the weir pool does not overtop during heavy monsoon rains.
| V-Notch Angle | Typical Flow Range | Sensitivity Profile | Primary Application in Dam Monitoring |
|---|---|---|---|
| 90° | 1 L/s to >150 L/s | Standard baseline | The most versatile standard configuration. Used in main downstream toe drains and seepage collection trenches. |
| 60° | < 10 L/s | High (head rises faster per unit flow) | Narrow inspection galleries where seepage volumes are low but early detection of minute changes is a priority. |
| 45° | < 5 L/s | Very High | Extreme low-flow zones. Provides the highest vertical head change per liter, maximizing sensor resolution. |
| 120° | up to 300-400 L/s | Low (handles large volume with minimal head rise) | Main terminal drainage channels that must accommodate massive wet-season flows without requiring excessively wide concrete channel walls. |
Kindsvater-Shen Formula (ISO 1438) and Weir Pool Sizing
Many field crews still rely on simplified, uncorrected formulas like the basic Thompson equation. These outdated methods ignore the physical realities of water viscosity and surface tension. ISO 1438 mandates the Kindsvater-Shen formula for structural safety reporting. It introduces an effective head correction ($k_h$) to account for these exact fluid properties. For a standard 90° notch, this head correction adds roughly 0.85 mm ($0.00085 \text{ m}$) to the measured head.
The Kindsvater-Shen discharge equation for a V-notch weir is:
$Q = \frac{8}{15} \sqrt{2g} C_e \tan(\theta/2) h_e^{5/2}$
Where:
- $Q$ is the discharge rate.
- $g$ is gravitational acceleration.
- $C_e$ is the dimensionless effective discharge coefficient (a function of the notch angle $\theta$ and channel geometry).
- $h_e$ is the effective head ($h + k_h$).
The flow must approach the notch in a fully contracted state. This means the channel walls and floor do not restrict the flow lines. You have to size the weir pool correctly to make this happen. ISO 1438 dictates that the depth from the notch vertex to the channel floor ($P$) must be at least twice the maximum expected head ($P \ge 2h_{\max}$). The total channel width ($B$) must be at least four times the maximum head ($B \ge 4h_{\max}$). It is basic math. Ignore it, and your data is garbage.
Sensor placement matters. Water accelerates toward the notch, and the surface level drops in a curve. If you put the sensor too close, you will read an artificially low head. Place the measurement point upstream at a distance of 4 to 5 times the maximum head ($4$ to $5 h_{\max}$). Also, keep the approach velocity inside the weir pool below 0.15 m/s. Water approaching too fast distorts the head reading with kinetic energy. Install a perforated baffle or an underflow-overflow baffle at the pool entrance. It kills the kinetic energy and distributes the velocity profile evenly. You also have to clean the pool. Sediment or mud buildup reduces the effective depth $P$. This alters the flow contraction and easily causes a 5% to 10% measurement error.
Automated Level Sensors and Datalogger Virtual Channel Telemetry
Some old-school engineers still rely on manual staff gauge readings or mechanical float sensors inside prone-to-clog stilling wells. That is an outdated liability. Modern geotechnical monitoring demands better. The industry standard has already shifted to non-contact level measurement.
A non-contact ultrasonic sensor like the Rika RKL-03 Ultrasonic Water Level Sensor eliminates mechanical failures. You do not have to worry about bio-fouling, mud buildup, or algae growth inside dark inspection galleries. The RKL-03 gives you a measurement range of up to 2 meters with a tight ±0.25% Full Scale accuracy. Just make sure to mount it on a rigid, vibration-free bracket directly over the weir pool.
A sensor is just a raw data feed. The real intelligence lives in the edge computing hardware. The GEOVOS Datalogger 1000 handles these harsh telemetry jobs well. Bad setups transmit raw head data to a central server for processing. If the cellular connection drops, your data stops. Instead, the GEOVOS 1000 runs virtual channels at the edge. The datalogger calculates the Kindsvater-Shen formula locally. It instantly converts the raw ultrasonic distance measurements into a calibrated discharge rate in L/s or $\text{m}^3/\text{hr}$.
The GEOVOS firmware uses a running average filter. This smooths out micro-oscillations and surface ripples on the weir pool. The discharge calculation is exponential ($h^{5/2}$). A simple 5 mm ripple from wind or debris will trigger a massive, false spike in the calculated flow rate. The filter stops those false alarms. You configure the system with alarm thresholds based on absolute discharge limits or rapid rate-of-change (Delta Q / Delta t). It triggers local sirens and SMS alerts the exact moment anomalous seepage happens.
Reservoir Level Correlation (AWLR), Rainfall Parsing, and Turbidity Sensors for Early Piping Detection
Seepage does not happen in a vacuum. Under healthy operating conditions, the seepage discharge correlates directly with the reservoir’s water surface elevation. When the reservoir fills, hydraulic pressure increases. Seepage naturally rises. You have to cross-reference the weir discharge data with continuous data from an Automatic Water Level Recorder (AWLR) stationed at the reservoir pool. A seepage spike while the reservoir level is dropping or stable is a major red flag.
Direct surface runoff is another massive headache. Downstream toe drains often fill with localized rainfall. It makes it impossible to tell if a flow increase is a structural failure or just a heavy storm. An integrated dam early warning system pairs the seepage telemetry with an automated tipping-bucket rain gauge (ARR). This lets engineers perform rainfall parsing. The system algorithmically separates the immediate runoff spikes from the slower, sustained internal seepage flow.
Turbidity is the ultimate indicator of active internal erosion. A seepage discharge spike is bad news. But if that water is crystal clear, the core material is probably still in place. If that flow increase brings muddy, turbid water exceeding safety thresholds of 10 NTU, the clay core is actively washing out. You are looking at an advanced state of piping. You need immediate evacuation protocols. Put turbidity sensors next to the level sensor in the weir pool. It gives you the definitive verification you need for emergency disaster mitigation at tailings dams and conventional reservoirs.
Setting up a telemetry-based seepage monitoring system is not a plug-and-play job. You need solid hydraulic engineering, precise sensor positioning, and tough hardware. Conduct a proper monitoring site survey. It confirms the weir plate is sized correctly. It proves the approach velocity is controlled. Most importantly, it guarantees your telemetry network will actually deliver life-saving data when things go wrong.
Share this article
Share this insight with your team.
Related Articles
Similar topics from the same category.

8 mandatory monitoring criteria for PROPER Blue rating under PermenLH 7/2025: SPARING, AQMS, B3, waste, peatland, mining, and SIMPEL audit.

Compare TDR and FDR soil moisture sensor principles, dielectric calibration limits for tropical peat, and multi-depth telemetry integration via GEOVOS 1000.

Permen LHK 14/2024 ties SPARING telemetry to daily administrative fines. Understand the formula, sensor risks, and edge validation defense.