Selecting Water Level Sensors for Irrigation Canals and Agricultural Dams
Guide to selecting water level sensors for irrigation canals, dams, and gate structures comparing radar, ultrasonic, and hydrostatic technologies for efficient water distribution.
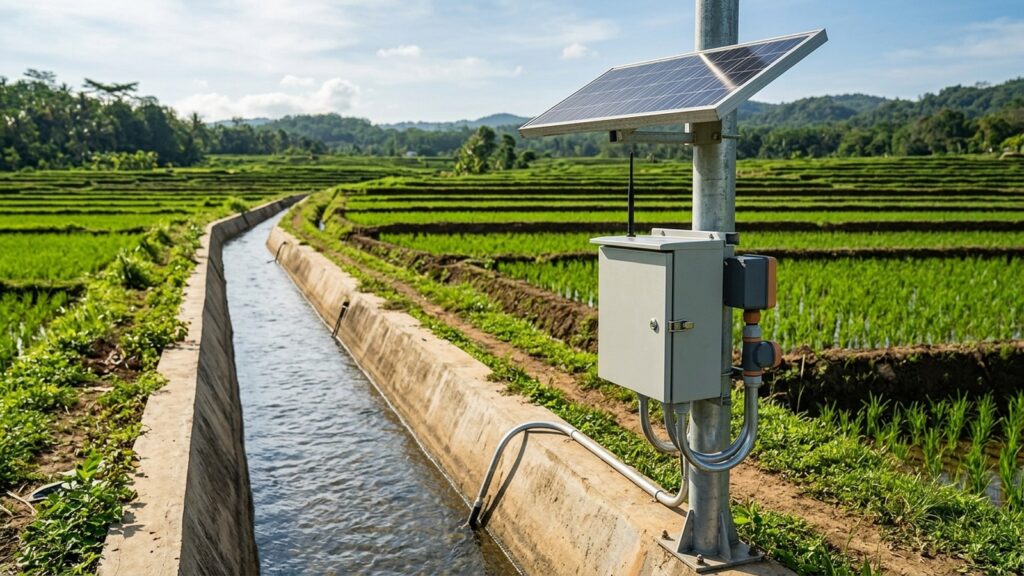
Irrigation networks in tropical regions lose enormous volumes of water every season. Not because there isn’t enough rainfall, but because operators are still distributing it by guesswork. Manual gate scheduling based on visual estimates and twice-daily staff gauge readings cannot keep up with rapidly changing canal conditions. Install the wrong irrigation water level sensor on a muddy open channel or a turbulent gate structure, and the data feeding your allocation model is already wrong before it reaches the dashboard. This guide walks through the sensor technologies, hydraulic constraints, and telemetry architecture that field engineers need to get right the first time.
Why Irrigation Needs Real-Time Water Level Data
Traditional rotation-based water distribution, where each tertiary block gets a fixed time slot regardless of actual crop demand, routinely delivers 40 to 50 percent conveyance efficiency. That means half the water diverted at the headworks never reaches the field. Indonesia’s Directorate General of Water Resources (Ditjen SDA), under the Ministry of Public Works and Housing (PUPR), addresses this through the 5 Pillars of Irrigation Modernization: water supply reliability, infrastructure reliability, water management operations, institutional strengthening, and human resource development. The Irrigation Modernization Trilogy sits alongside those pillars, targeting Real Time data, Real Losses identification, and Real Allocation based on actual crop water requirements.
Here is what that looks like at the field level. FAO Irrigation and Drainage Paper No. 56 and FAO Water Reports No. 32 (MASSCOTE) both establish that matching canal deliveries to crop evapotranspiration (ET0×Kc) demands continuous, accurate stage measurements at every diversion and offtake point. Without that data, volumetric allocation stays aspirational. Installing upstream and downstream level sensors at gate structures helps detect canal spills and seepage losses early, with potential water savings of 10 to 20 percent compared to manual rotation scheduling.
Regulatory Framework for Water Level Monitoring
The legal basis for irrigation monitoring in Indonesia is layered. Law No. 17/2019 on Water Resources establishes the state’s obligation to guarantee irrigation water availability for agriculture. Government Regulation PP No. 20/2006 on Irrigation, which through Article 88 explicitly revoked and replaced the older PP No. 77/2001, provides the main operational framework.
At the operational level, Ministry of Public Works Regulation Permen PUPR No. 12/PRT/M/2015 on Irrigation Network Exploitation and Maintenance mandates that flow measurements be recorded regularly at intake structures and distribution points. These records serve as the basis for the annual Water Allocation and Distribution Plan (RPPA) and the Irrigation System Performance Index (IKSI). Permen PUPR No. 14/PRT/M/2015 further divides jurisdictional authority: the central government manages irrigation areas exceeding 3,000 hectares, provincial governments manage 1,000 to 3,000 hectares, and district governments handle areas under 1,000 hectares. This layered authority means sensor procurement specifications need to match the institutional tier handling operations and maintenance.
Hydraulic Measurement Points: Channels, Gates, and Reservoirs
Not every measurement point in an irrigation network behaves the same way. The sensor that works perfectly on a primary canal intake may fail within weeks at a tertiary offtake or a small farm reservoir. Three distinct environments demand different instrumentation strategies.
Primary and secondary canals carry the highest sediment loads. Thick silt deposits, sand accumulation, and invasive aquatic weeds like water hyacinth create a harsh environment for any sensor element that contacts the water surface. Contact-based instruments (submersible pressure sensors, float mechanisms) face continuous fouling risk.
Gate and diversion structures present a different problem. Turbulence downstream of partially opened gates creates violent water surface oscillations. The standard flow measurement structures described in KP-04 Planning Criteria, including Romijn weirs, Crump-de Gruyter undershot gates, broad-crested weirs, Cipoletti weirs, and Parshall flumes, all require precise upstream head readings to compute discharge. Erratic surface conditions at these structures demand sensors with fast sampling rates and signal filtering capability.
Farm reservoirs and small dams (embung) experience large seasonal water level fluctuations combined with heavy bottom sedimentation from upstream catchment erosion. During dry season drawdown, sensor mounting must accommodate several meters of level change without losing accuracy.
Sensor Technology Comparison
Four sensor technologies cover the range of irrigation measurement scenarios. The table below compares their operational characteristics in open-channel irrigation environments.
| Parameter | Radar 80 GHz FMCW | Ultrasonic | Hydrostatic Submersible | Surface Velocity Radar GRD-900 |
|---|---|---|---|---|
| Mounting | Non-contact, above water | Non-contact, above water | Submerged in water | Non-contact, above water |
| Accuracy | ±2 mm | ±3–5 mm typical | ±0.1% FS | Level ±2 mm + velocity |
| Beam angle | Narrow (3°–8°) | Wide (8°–15°) | N/A | Narrow |
| Sediment tolerance | Excellent (no water contact) | Moderate (surface foam/debris can cause false echoes) | Poor (membrane clogs without stilling well) | Excellent (no water contact) |
| Temperature sensitivity | Negligible (electromagnetic wave) | High (speed of sound shifts ~0.17%/°C) | Low (direct pressure measurement) | Negligible (electromagnetic wave) |
| Weed/debris interference | Low (narrow beam passes through gaps) | High (false echoes from floating vegetation) | High (physical entanglement) | Low (measures surface velocity and level simultaneously) |
| Backwater conditions | Measures level only; single H-Q rating curve may be invalid | Measures level only; same H-Q limitation | Measures level only; same H-Q limitation | Solves backwater problem with index velocity method |
| Maintenance | Minimal (periodic lens cleaning) | Moderate (transducer face cleaning, temperature calibration) | High (membrane cleaning, biofouling removal) | Minimal (periodic lens cleaning) |
| Best fit | Primary/secondary canals, gate structures, reservoirs | Sheltered indoor channels, temperature-stable environments | Reservoirs and quiet impoundments with stilling well | Canals affected by tidal backwater or variable downstream gate operation |
80 GHz FMCW Radar is the strongest general-purpose choice for tropical open channels. Its narrow beam angle avoids sidewall reflections, and electromagnetic waves are unaffected by the steep air temperature gradients that form above sun-heated canal water surfaces during the day. No part of the sensor contacts the water, so sediment, algae, and floating trash have zero impact on the measurement element. For more detail on choosing between radar, ultrasonic, and hydrostatic sensors, see our technology comparison guide.
Ultrasonic sensors measure the time-of-flight of a sound pulse reflected from the water surface. The physics are straightforward. But tropical field conditions undermine reliability. Air temperature above an open canal can swing 15 to 20 °C between early morning and midday, creating density gradients that shift the speed of sound by approximately 0.17 percent per degree Celsius. That error compounds across longer measurement ranges. Floating weeds and surface foam generate false echo returns. Ultrasonic sensors remain viable in enclosed or temperature-controlled channel sections, but they are a risky default for exposed Indonesian irrigation canals.
Hydrostatic submersible sensors measure the water column pressure directly. They are cost-effective and accurate in calm water. The catch: placing one at the bottom of a silty irrigation canal without a protective stilling well is a recipe for membrane fouling within weeks. In farm reservoirs or embung with quiet water and a properly installed vertical stilling pipe or intake tower, a vented hydrostatic sensor remains a reliable and economical solution.
GRD-900 Surface Velocity Radar combines non-contact water level measurement with surface velocity detection. When downstream gate operations or tidal influence create backwater conditions, a single-point stage reading fed into a standard H-Q rating curve produces invalid discharge values. The GRD-900 addresses this by measuring both parameters simultaneously and applying the index velocity method to compute discharge regardless of flow direction. It fills a gap that conventional stage-only sensors cannot.
Converting Stage to Discharge: KP-04 Hydraulic Formulas
Water level data alone does not tell an irrigation manager how much water is flowing. The real operational value comes from converting that stage reading into volumetric discharge (m³/s). Indonesia’s KP-04 Irrigation Planning Criteria specify the hydraulic relationships for standard measurement structures.
For broad-crested weirs and free-overflow spillways, the basic relationship is exponential:
Q=C⋅b⋅h1.5
where Q is discharge, C is the structure-specific discharge coefficient, b is the crest width, and h is the upstream head above the crest. The 1.5 exponent means a small error in level measurement amplifies into a larger error in computed discharge. That is precisely why millimeter-level sensor accuracy matters at these structures.
Romijn weirs use an adjustable crest plate at tertiary offtakes. The gate operator raises or lowers the crest to regulate flow, and the upstream head above the crest determines discharge directly. Automating this measurement eliminates reliance on visual staff gauge readings that operators typically record only once or twice daily.
Crump-de Gruyter structures work differently: they measure undershot flow through a partially opened sluice gate. Computing discharge requires both the upstream water level and the vertical gate opening position. Accurate stage sensing on both sides of the structure is essential for these calculations. For a deeper explanation of the relationship between water level and discharge, including rating curve principles, we have covered the topic in a dedicated article.
Remote Telemetry Architecture: Solar Power and Store-and-Forward
Most irrigation measurement points in Indonesia sit far from grid electricity. A monitoring station that depends on a power line that does not exist is not a monitoring station. It is a plan that never got executed. Reliable field deployment requires a self-contained power and telemetry architecture.
Irrigation AWLR stations run on standalone solar PV systems, typically 50 to 100 Wp panels paired with deep-cycle batteries (VRLA or LiFePO₄). The GEOVOS 1000 Datalogger serves as the station’s central processing unit. It accepts multiple sensor input protocols (SDI-12, RS-485 Modbus RTU, 4–20 mA analog, and pulse), making it compatible with the full range of level sensors described above.
What sets the GEOVOS 1000 apart from basic data loggers is on-board edge computing. The KP-04 hydraulic formulas and polynomial H-Q rating curves are programmed directly into the datalogger firmware. Stage-to-discharge conversion happens locally, in real time, at the measurement point itself. No dependency on a remote server to perform the calculation. The datalogger transmits computed discharge, cumulative flow volume, and raw water elevation data over cellular 4G/LTE or LoRaWAN to the water authority’s cloud dashboard.
Non-volatile store-and-forward memory makes sure no data is lost during cellular network outages, which are common at rural canal sites. When connectivity returns, buffered records transmit automatically. The system also triggers threshold-based alarm notifications via WhatsApp, SMS, or email when water levels exceed safe operating limits at dam spillways or critical gate structures.
An automatic weather station deployed alongside the AWLR station provides local evapotranspiration data, enabling irrigation managers to compare actual canal deliveries against computed crop water demand using the FAO-56 methodology.
Fortuna Argatech Irrigation Monitoring Solutions
Fortuna Argatech integrates complete AWLR stations specifically engineered for irrigation network monitoring. The engineering scope covers site hydraulic surveys, custom galvanized steel bracket fabrication for bridge-mounted canal installations, standalone solar PV power systems, sensor calibration against reference staff gauges, and full integration with provincial or national water authority monitoring dashboards.
Field teams program the GEOVOS 1000 with the site-specific hydraulic equations for each measurement structure, whether it is a Romijn weir, a Parshall flume, or a compound rating curve. The result is a station that delivers both raw stage data and computed discharge values from the moment it is commissioned. For canals affected by variable backwater, the GRD-900 surface velocity radar sensor provides the index-velocity measurement that conventional stage-only instruments miss.
Deploying AWLR telemetry across an irrigation network supports measurable improvements in Irrigation System Performance Index (IKSI) scores, fairer water distribution at the farmer association (P3A) level, and transparent data for seasonal crop planning. For site-specific technical consultation, engineering survey coordination, or procurement planning, contact the Fortuna Argatech engineering team.
Procurement Guide and Implementation Checklist
Before drafting procurement specifications or installing stations, irrigation managers should work through five engineering steps:
- Hydraulic and sediment survey. Walk every planned measurement point. Document canal lining material (concrete, masonry, or earth), sediment load severity, weed growth patterns, and the type of measurement structure present (Romijn, Crump, broad-crested weir, or Parshall flume). This determines which sensor technology fits each location.
- Sensor technology selection. Match the sensor to the site. Use 80 GHz FMCW radar for high-sediment open channels and gate structures. Use vented hydrostatic sensors in calm reservoirs with stilling wells. Deploy GRD-900 surface velocity radar where backwater conditions invalidate single-point H-Q rating curves.
- Power and mounting design. Size the solar panel and battery bank for continuous 24-hour operation with at least 3 days of autonomy during overcast conditions. Design galvanized mounting brackets for vibration resistance on canal bridges. Plan conduit routing and lightning protection.
- Datalogger configuration. Program KP-04 hydraulic equations or site-calibrated H-Q polynomial rating curves into the GEOVOS 1000. Set sampling intervals, alarm thresholds for high and low water levels, and data transmission schedules.
- Maintenance protocol. Establish a routine inspection schedule: clean radar sensor lenses quarterly, verify calibration against reference gauges semi-annually, inspect solar panel connections, and test cellular connectivity. A sensor that delivers accurate data on day one but drifts unchecked for two years provides a false sense of precision.
Each step reduces the risk of equipment sitting idle at a canal bank because the wrong sensor was specified, the solar panel was undersized, or the rating curve was never programmed into the logger. Proper planning turns a procurement line item into a functioning measurement station that actually delivers the volumetric data irrigation modernization demands.
Share this article
Share this insight with your team.