How to Size Solar Panels and Batteries for Remote Monitoring Stations
Step-by-step method to calculate solar panel watt-peak, battery Ah capacity, and charge controller rating for off-grid monitoring stations.
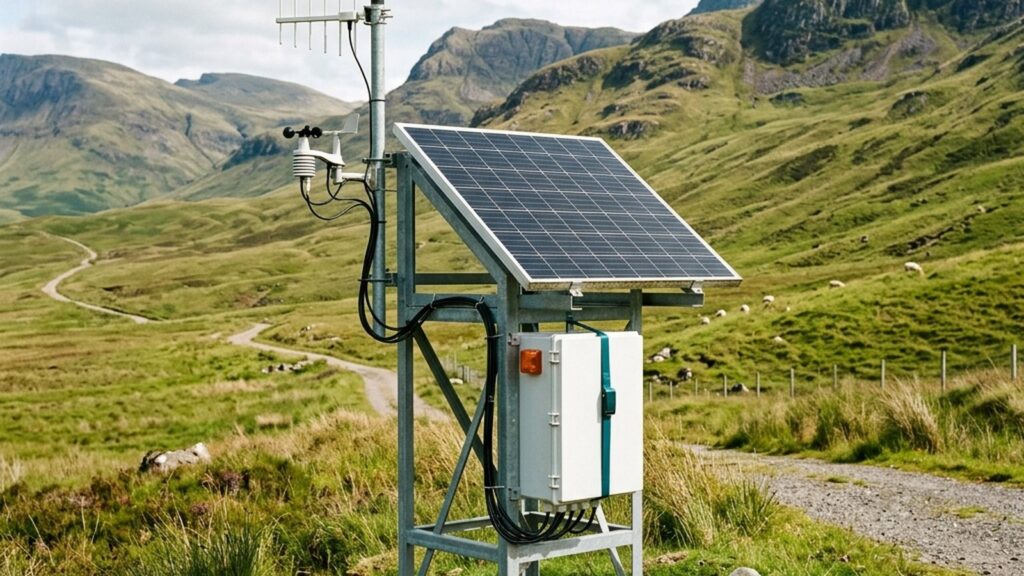
A monitoring station that goes dark during the rainy season is rarely a weather casualty — it is a sizing failure. An undersized solar power system cannot recharge batteries fast enough to sustain operation through consecutive overcast days. An oversized system wastes budget that could go toward additional sensors or site infrastructure.
This article presents a step-by-step method to calculate the solar panel watt-peak rating, battery capacity in ampere-hours (Ah), and charge controller specification your remote monitoring station needs. The formulas follow standard off-grid solar engineering practice, consistent with guidance in the USGS Techniques and Methods 1-D3 for hydrological monitoring station power systems.
Step 1: Build Your Load Inventory
Every sizing calculation starts with a load inventory — a complete list of every device that draws power at the station. Without this list, the rest is guesswork, and guesswork in power system design means risking data gaps.
Typical devices at a monitoring station include:
- Sensors — water level probes, rain gauges, wind sensors, water quality probes, or other parameters depending on the monitoring objective
- Data logger or gateway — the device that reads sensors, timestamps data, stores records, and transmits them
- Cellular modem — transmits data over 4G/LTE networks; power consumption varies dramatically between sleep, idle, and transmit modes
- Local display — if installed
- Heater or fan — for stations operating in extreme temperature conditions
- Auxiliary devices — indicator lights, warning sirens, maintenance charging ports
Cellular modems deserve special attention. During transmission bursts, a modem draws significantly higher current than during idle or sleep. If the transmission interval is every 5 minutes, the cumulative burst duration per day can be substantial. Record the power draw for each mode and estimate the daily duration of each.
For every device, record:
| Device | Power (watts) | Operating hours/day | Daily energy (Wh) |
|---|---|---|---|
| Sensor 1 | … | … | … |
| Data logger | … | … | … |
| Modem — sleep | … | … | … |
| Modem — transmit | … | … | … |
| Other devices | … | … | … |
| Total | … Wh/day |
Take watt values from each device’s datasheet. Do not use rough estimates or copy values from a different project that uses different sensors — every station configuration has a unique load profile.
Step 2: Calculate Daily Energy Consumption (Wh/day)
The basic formula:
Daily energy (Wh) = Device power (W) × Operating hours per day (h)
Sum across all devices to get total Wh/day. This number drives every subsequent calculation.
For contextual reference, a Fortuna Argatech article on flood EWS essential components notes that a standard flood early warning station requires approximately 10 to 20 watts of continuous power. For a 15 W continuous station, daily consumption becomes:
15 W × 24 hours = 360 Wh/day
This is an illustrative example only. Actual load must come from the device-level inventory in Step 1. Stations with multiple analog sensors, frequent modem transmissions, or warning sirens will have higher total Wh/day figures.
Step 3: Determine Autonomy Days
Autonomy days represent how many days the system must continue operating with no sunlight at all — the worst case during extended heavy cloud cover.
Environmental monitoring stations in Indonesia typically target 3 to 5 days of autonomy. This reflects tropical rainy-season conditions where several consecutive days can be heavily overcast.
Factors that determine your autonomy target:
- Local weather patterns — regions with intense rainy seasons need higher autonomy
- Data criticality — a flood EWS or dam monitoring station cannot go offline during heavy rain; that is precisely when the data matters most
- Maintenance access frequency — remote sites that are difficult to reach need longer autonomy because crews cannot quickly arrive to manually recharge batteries
For this worked example, we use 4 days of autonomy.
Step 4: Size the Battery Bank (Ah)
Formula:
Battery capacity (Ah) = (Daily Wh × Autonomy days) ÷ (System voltage × Depth of Discharge)
Parameters to determine:
- System voltage — typically 12 V for standard monitoring stations
- Depth of Discharge (DoD) — lead-acid deep-cycle batteries should not regularly discharge below 50% of rated capacity to preserve lifespan. Lithium batteries typically allow 80% depth of discharge
Lead-acid example:
With a 360 Wh/day load and 4 autonomy days:
- Total energy to store: 360 × 4 = 1,440 Wh
- Battery capacity: 1,440 ÷ (12 × 0.50) = 240 Ah
Lithium example:
- Battery capacity: 1,440 ÷ (12 × 0.80) = 150 Ah
Lithium batteries require lower Ah capacity for the same autonomy because of their deeper allowable DoD. However, battery type selection also depends on upfront cost, availability, temperature conditions, and safety standards at the installation site.
Industrial solar panels can generally last over 10 years, while deep-cycle storage batteries are recommended for routine inspection or replacement every 2 to 4 years.
Important note: High ambient temperatures reduce the effective capacity of lead-acid batteries. For sites with consistently high temperatures, consult the temperature correction factor from the selected battery’s datasheet.
Step 5: Size the Solar Panel (Wp)
Formula:
Panel Wp = Daily energy (Wh) ÷ (Peak Sun Hours × System efficiency)
Parameters to know:
- Peak Sun Hours (PSH) — the effective hours of full sunlight per day at your installation site. In tropical Indonesia, PSH ranges approximately 3.5 to 5.5 hours depending on location, season, and cloud conditions. Verify the specific PSH for your site using the NASA POWER database or BMKG climate data
- System efficiency — accounts for energy losses in cables, charge controller, battery, and panel conditions. A value of 0.70 to 0.80 (70–80%) is commonly used for initial estimates
Worked example:
With a 360 Wh/day load, 4 hours PSH, and 0.75 system efficiency:
Panel Wp = 360 ÷ (4 × 0.75) = 120 Wp
This means a solar panel rated at minimum 120 watt-peak is needed. In practice, selecting a panel slightly above the calculated result provides margin for panel degradation, dust accumulation, and unexpected weather variation.
For comparison, a Fortuna Argatech article on flood EWS records the use of 50 to 100 Wp panels with 12 V deep-cycle batteries for 3 to 5 days of autonomy. The variation reflects differences in load across station configurations.
Step 6: Select the Charge Controller
The charge controller manages current flow from the solar panel to the battery, prevents overcharging, and can optimize energy transfer. Two main types:
PWM (Pulse Width Modulation):
- Simpler and more economical
- Works best when panel voltage and battery voltage are already close
- Suitable for small systems with a 12 V panel charging a 12 V battery directly
MPPT (Maximum Power Point Tracking):
- Can be 15 to 30% more efficient than PWM, especially when panel voltage significantly exceeds battery voltage
- Converts excess voltage into additional charging current
- More beneficial with higher-voltage panels or when long cable runs cause voltage drop
Charge controller current rating:
Select a charge controller rated for at least 125% of the solar panel’s short-circuit current (Isc). The 1.25× safety factor is standard practice to account for high-irradiance conditions that can produce current above the panel’s nominal rating.
Example: if a 120 Wp panel has an Isc of 7.5 A, the charge controller should be rated for at least 7.5 × 1.25 = 9.4 A (select 10 A or higher).
Also confirm that the charge controller supports the open-circuit voltage (Voc) of the selected solar panel, particularly at low temperatures when Voc can increase.
Worked Example: Sizing a Flood EWS Station
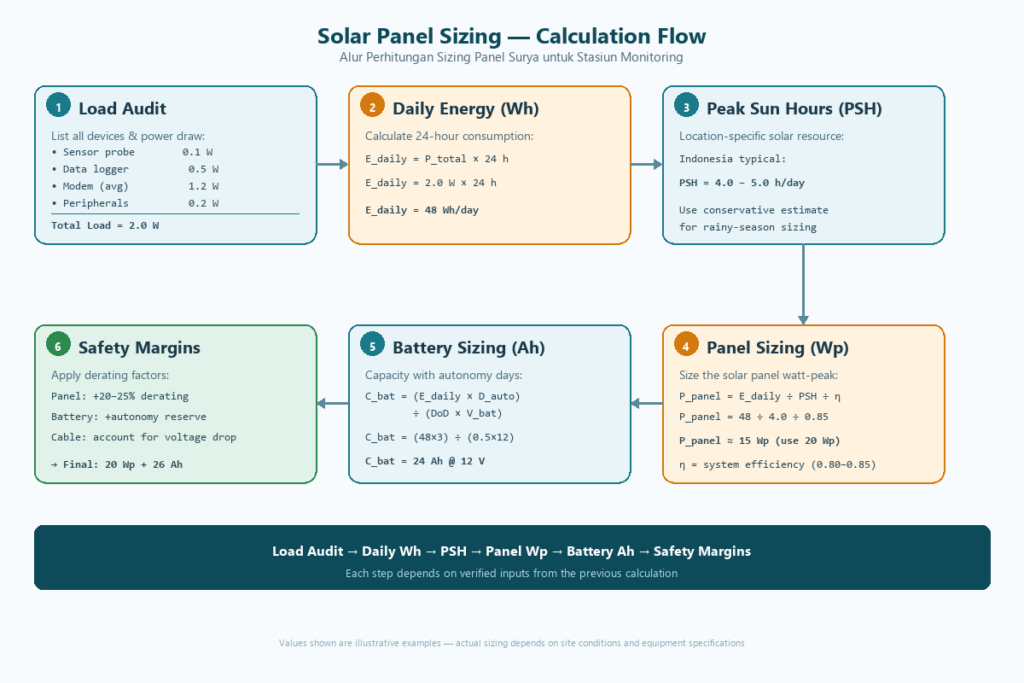
Below is the complete method applied to a flood EWS station scenario using data from a published Fortuna Argatech components article. This is an illustrative application scenario — actual configurations depend on the specific equipment selected.
| Parameter | Value | Source |
|---|---|---|
| Continuous load | 15 W (midpoint of 10–20 W range) | Argatech EWS article |
| Daily energy | 15 × 24 = 360 Wh/day | Calculation |
| Autonomy days | 4 days | Target for tropical river site |
| Battery type | Lead-acid deep-cycle, 50% DoD | Standard practice |
| System voltage | 12 V | Common for monitoring |
| Battery capacity | (360 × 4) ÷ (12 × 0.50) = 240 Ah | Calculation |
| Site PSH | 4 hours (verify via NASA POWER/BMKG) | Tropical estimate |
| System efficiency | 0.75 | Standard |
| Panel Wp | 360 ÷ (4 × 0.75) = 120 Wp | Calculation |
| Charge controller | MPPT, min. 125% × panel Isc | Standard practice |
These numbers are a starting point. Actual load must come from the datasheet of the equipment being installed, not from general range estimates. PSH values must be verified for the specific location.
Common Sizing Mistakes
Several errors can cause a system to fail at maintaining continuous data logging:
- Ignoring modem power spikes — calculating only average watts without accounting for transmission bursts that peak well above idle draw. Use the burst duration and peak current from the modem datasheet.
- Mounting the panel flat or facing the wrong direction — in Indonesia, solar panels should be tilted approximately 10 to 15 degrees toward the equator. A flat-mounted panel receives less direct radiation, and incorrect orientation reduces effective charging hours.
- Not accounting for shading — trees, buildings, or masts nearby that shade the panel even for a few hours per day can drastically reduce output. A Fortuna Argatech weather sensor installation guide notes that thick dust deposits alone can reduce battery charging efficiency by up to 40%.
- Skipping DoD in battery calculations — using 100% of a lead-acid battery’s capacity accelerates degradation and significantly shortens service life.
- Ignoring temperature effects on battery capacity — high temperatures at exposed sites reduce the effective capacity of lead-acid batteries. This must be accounted for using the temperature coefficient from the battery datasheet.
When to Request a Professional Assessment
The sizing method above applies to standard monitoring stations with one sensor set, one data logger, and one modem. Some conditions call for a more detailed power system assessment:
- Multi-sensor arrays — AQMS stations or full weather stations with many sensors have more complex load profiles
- SPARING compliance systems — Indonesian online wastewater monitoring regulatory compliance requires very high data availability
- Sirens or high-power devices — peak loads when an EWS siren activates are far greater than normal monitoring loads
- Hybrid power needs — sites with partial grid access require hybrid solar-grid design
The monitoring site survey article provides a complete framework for documenting power requirements as part of project planning.
For configurations beyond a standard single-sensor station, Fortuna Argatech can help map the load inventory, determine autonomy targets based on site conditions, and calculate appropriate solar power specifications. Contact the technical team through the contact page for sizing consultation based on your project requirements.
Share this article
Share this insight with your team.
Related Articles
Similar topics from the same category.
Discover how green energy allows a Solar Powered Environmental Sensor from Fortuna Argatech to operate 24/7 in remote locations without grid electricity.